Full Report
The numbers behind The Marzetti Company: as-reported financial statements and company metrics for FY2021–FY2025, traced to the source filings, opened with the share-price history those statements have to justify. Every linked figure opens the exact page of the filing it was printed on, with the statement row highlighted. Amounts in US$ thousands unless noted.
Reading notes: All figures are in US$ thousands, the scale the company prints on its financial statements (“Amounts in thousands, except per share data”). Per-share amounts and percentages are as printed. Each fiscal year is cited to that year's own Form 10-K, so every figure in the FY2021-FY2025 columns is a first-column (current-year) figure on the cited page rather than a comparative. Lancaster Colony Corporation was renamed The Marzetti Company effective June 27, 2025; the FY2021-FY2024 Forms 10-K are filed under the Lancaster Colony name. The fiscal year ends June 30. The company carried no outstanding borrowings on its revolving credit facility at any June 30 balance-sheet date shown, so no debt line appears on the balance sheet.
Share Price — Full Available History — 37 Years
The stock closed at $110.19 on Jul 28, 2026 — up 1,663% over the window shown (+8.2% a year), trading between $3.25 and $218.84. At that close the stock trades at 18× FY2025 diluted EPS as reported below.
Source: market price feed, monthly closes, sampled from 9,210 source observations, Jan 1990–Jul 2026. Price return only, excludes dividends.
Market capitalization $3.0bn and enterprise value $2.9bn.
Market cap = 27.4M shares outstanding × the Jul 28, 2026 close of $110.19. Enterprise value adds total debt of $0 and subtracts cash and equivalents of $161mn (net cash of $161mn), from the FY2025 balance sheet. Market-derived figures, shown without filing links.
FY2025 at a Glance
Revenue (US$ thousands)
Operating income (US$ thousands)
Net income (US$ thousands)
Diluted EPS
Source: FY2025 consolidated statements [1] [2] [3] [4]. Click any linked figure to open the filing page with the row highlighted.
Net Sales by Class of Similar Products
| Net Sales by Class of Similar Products | FY2021 | FY2022 | FY2023 | FY2024 | FY2025 |
|---|---|---|---|---|---|
| Shelf-stable dressings, sauces and croutons | 297,572 | 375,031 | 422,646 | 424,605 | 431,197 |
| Frozen breads | 308,482 | 331,812 | 343,450 | 351,063 | 380,601 |
| Refrigerated dressings, dips and other | 222,909 | 208,367 | 199,274 | 212,756 | 191,611 |
| Total Retail net sales | 828,963 | 915,210 | 965,370 | 988,424 | 1,003,409 |
| Dressings and sauces | 477,940 | 574,264 | 642,153 | 660,460 | 664,013 |
| Frozen breads and other | 156,457 | 186,916 | 215,004 | 222,875 | 227,463 |
| Other roll products | 3,707 | 0 | 0 | 0 | 0 |
| Other dressings and sauces for TSA | 0 | 0 | 0 | 0 | 14,237 |
| Total Foodservice net sales | 638,104 | 761,180 | 857,157 | 883,335 | 905,713 |
| Total net sales | 1,467,067 | 1,676,390 | 1,822,527 | 1,871,759 | 1,909,122 |
Source: Form 10-K Business Segment Information note - net sales disaggregated by class of similar products for the Retail and Foodservice segments [5] [6] [7] [8]. Click any linked figure to open the filing page with the row highlighted.
Segment Operating Income
| Segment Operating Income | FY2021 | FY2022 | FY2023 | FY2024 | FY2025 |
|---|---|---|---|---|---|
| Retail | 188,403 | 151,627 | 139,464 | 207,660 | 211,695 |
| Foodservice | 89,048 | 82,745 | 106,349 | 97,094 | 111,579 |
| Operating Income | 185,852 | 111,911 | 141,508 | 199,363 | 220,317 |
Source: Form 10-K Business Segment Information note; consolidated operating income per the Consolidated Statements of Income. The gap between the two segments and consolidated operating income is nonallocated corporate expense and nonallocated restructuring and impairment charges. [5] [1] [9] [2]. Click any linked figure to open the filing page with the row highlighted.
Income Statement
Source: Consolidated Statements of Income [1] [2] [3] [4]. Click any linked figure to open the filing page with the row highlighted.
Columns marked E are consensus analyst estimates from S&P Capital IQ (CapIQ), shown alongside reported results for direct comparison; they are not company guidance.
Estimate source: S&P Capital IQ (CapIQ) consensus, as of 2026-07-29. Estimate figures are S&P Capital IQ consensus (vendor data — no filing page links). EPS and net income use the normalized (adjusted) consensus where the street reports it. Line-item analyst models (segments, drivers, KPIs) are in the Visible Alpha tab.
Balance Sheet
Source: Consolidated Balance Sheets [10] [11] [12] [13]. Click any linked figure to open the filing page with the row highlighted.
Cash Flow
Source: Consolidated Statements of Cash Flows [14] [15] [16] [17]. Click any linked figure to open the filing page with the row highlighted.
Volume, Mix and Channel Split
| Volume, Mix and Channel Split | FY2021 | FY2022 | FY2023 | FY2024 | FY2025 |
|---|---|---|---|---|---|
| Consolidated sales volume, pounds shipped (change vs prior year) | 3.0% | 2.0% | (5.0%) | 3.7% | 1.2% |
| Retail segment sales volume, pounds shipped (change vs prior year) | 11.0% | 2.0% | (4.0%) | 1.4% | 1.6% |
| Foodservice segment sales volume, pounds shipped (change vs prior year) | (1.0%) | 2.0% | (5.0%) | 5.3% | 0.9% |
| Retail share of net sales (segment sales mix) | 57% | 55% | 53% | 53% | 53% |
| Foodservice share of net sales (segment sales mix) | 43% | 45% | 47% | 47% | 47% |
Source: company filings [18] [19] [20] [21]. Click any linked figure to open the filing page with the row highlighted.
Margins as Reported by the Company
| Margins as Reported by the Company | FY2021 | FY2022 | FY2023 | FY2024 | FY2025 |
|---|---|---|---|---|---|
| Gross margin | 26.4% | 21.2% | 21.3% | 23.1% | 23.9% |
| Operating margin | 12.7% | 6.7% | 7.8% | 10.7% | 11.5% |
| Retail segment operating margin | 22.7% | 16.6% | 14.4% | 21.0% | 21.1% |
| Foodservice segment operating margin | 14.0% | 10.9% | 12.4% | 11.0% | 12.3% |
| Effective tax rate | 23.4% | 20.3% | 22.3% | 22.8% | 21.6% |
| Adjusted operating income (non-GAAP) | — | — | — | 216,837 | 229,200 |
Source: company filings [18] [19] [22] [20]. Click any linked figure to open the filing page with the row highlighted.
Foodservice Customer Mix and Overhead
| Foodservice Customer Mix and Overhead | FY2021 | FY2022 | FY2023 | FY2024 | FY2025 |
|---|---|---|---|---|---|
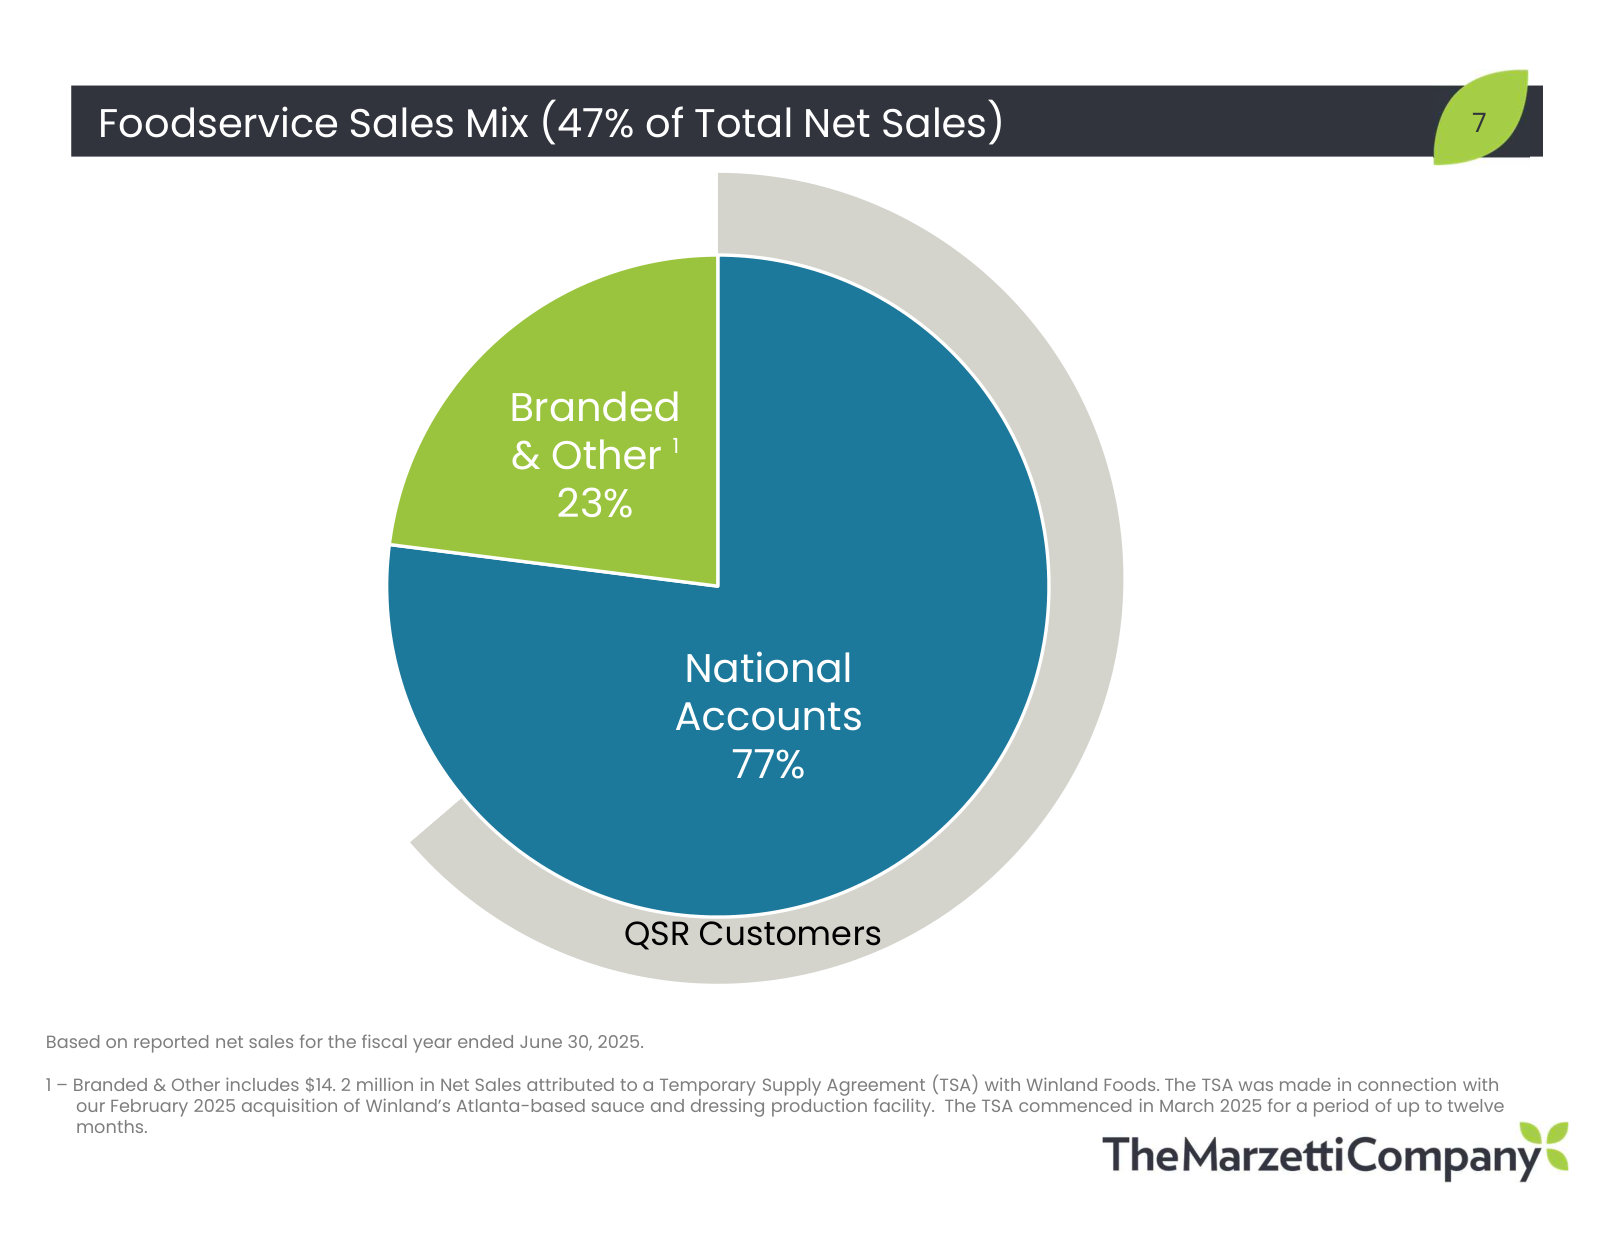
| Foodservice net sales - national accounts | 494,874 | 588,955 | 676,665 | 692,340 | 693,583 |
| Foodservice net sales - branded and other | 139,523 | 172,225 | 180,492 | 190,995 | 197,893 |
| Nonallocated corporate expenses (MD A, as stated) | 91,600 | 97,000 | 104,300 | 90,500 | 97,900 |
| Advertising expense as a percentage of net sales | 2% | 1% | 1% | 2% | 2% |
Source: company filings [5] [23] [18] [6]. Click any linked figure to open the filing page with the row highlighted.
Shareholder Returns
| Shareholder Returns | FY2021 | FY2022 | FY2023 | FY2024 | FY2025 |
|---|---|---|---|---|---|
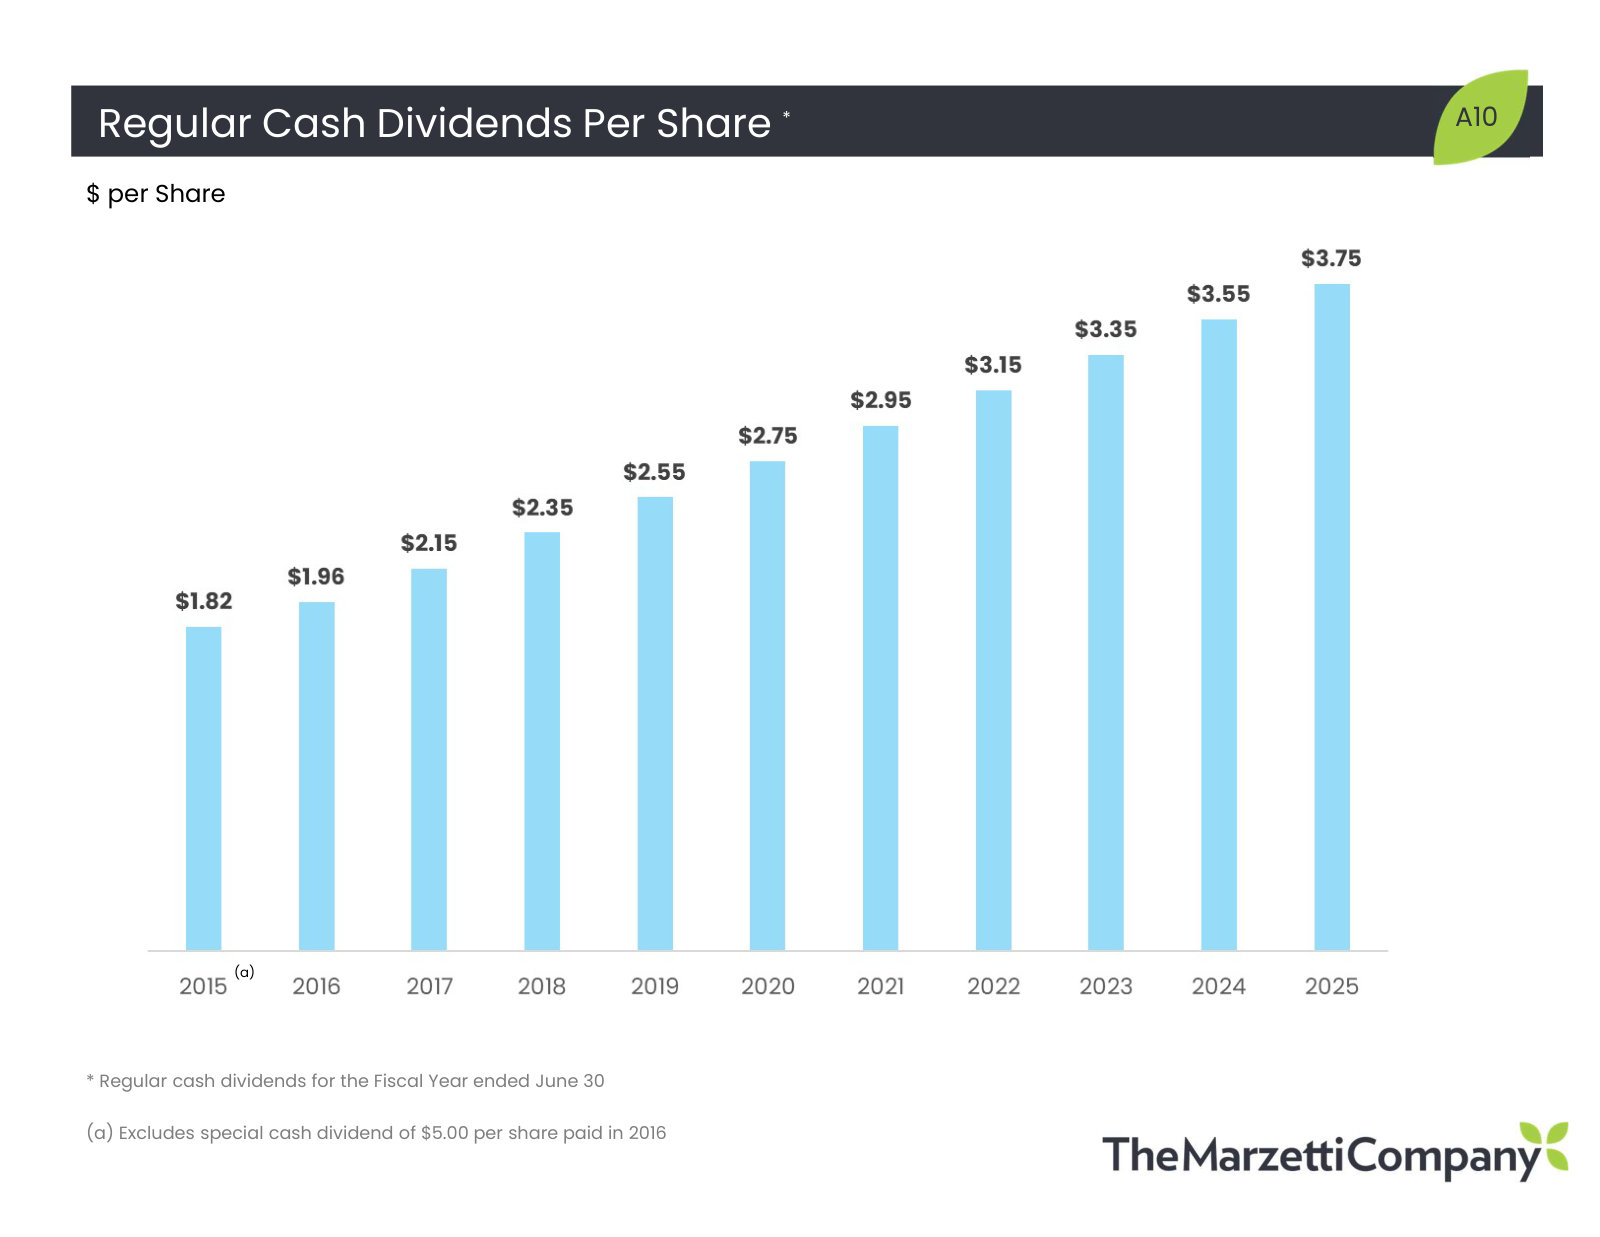
| Regular dividend payout rate per common share | 2.95 | 3.15 | 3.35 | 3.55 | 3.75 |
| Consecutive years of increased regular cash dividends | 58 | 59 | 60 | 61 | 62 |
| Common shares remaining under repurchase authorization | 1,269,701 | 1,225,545 | 1,176,739 | 1,131,564 | 1,083,830 |
Source: company filings [24] [25] [26] [27]. Click any linked figure to open the filing page with the row highlighted.
Workforce and Manufacturing Footprint
| Workforce and Manufacturing Footprint | FY2021 | FY2022 | FY2023 | FY2024 | FY2025 |
|---|---|---|---|---|---|
| Employees at June 30 | 3,200 | 3,200 | 3,400 | 3,400 | 3,700 |
| Employees represented under collective bargaining contracts | 24% | 24% | 23% | 22% | 18% |
| Space used for operations (sq ft) | 2,300,000 | 2,500,000 | 2,600,000 | 2,700,000 | 2,900,000 |
| Of which leased (sq ft) | 700,000 | 800,000 | 700,000 | 900,000 | 900,000 |
Source: company filings [28] [29] [30] [31]. Click any linked figure to open the filing page with the row highlighted.
Long-Term Record
| Fiscal year | Net Sales | Operating Income | Net Income | Net Income Per Common Share - Diluted | Net cash provided by operating activities | Payments for property additions |
|---|---|---|---|---|---|---|
| FY2017 | 1,201,842 | 174,354 | 115,314 | 4.20 | 146,385 | (27,005) |
| FY2018 | 1,222,925 | 171,548 | 135,314 | 4.92 | 160,714 | (31,025) |
| FY2019 | 1,307,787 | 190,924 | 150,549 | 5.46 | 197,598 | (70,880) |
| FY2020 | 1,334,388 | 175,948 | 136,983 | 4.97 | 170,769 | (82,642) |
| FY2021 | 1,467,067 | 185,852 | 142,332 | 5.16 | 174,189 | (87,865) |
| FY2022 | 1,676,390 | 111,911 | 89,586 | 3.25 | 101,813 | (131,972) |
| FY2023 | 1,822,527 | 141,508 | 111,286 | 4.04 | 225,901 | (90,181) |
| FY2024 | 1,871,759 | 199,363 | 158,613 | 5.76 | 251,553 | (67,576) |
| FY2025 | 1,909,122 | 220,317 | 167,347 | 6.07 | 261,496 | (58,000) |
Source: consolidated statements across filings; older years from the standardized feed [14] [1] [15] [2]. Click any linked figure to open the filing page with the row highlighted.
Operating KPIs
| KPI | FY2021 | FY2022 | FY2023 | FY2024 | FY2025 |
|---|---|---|---|---|---|
| Net sales attributed to Walmart (percent of consolidated net sales) | 18% | 18% | 18% | 18% | 19% |
| Net sales attributed to Chick-fil-A (percent of consolidated net sales) | 21% | 24% | 26% | 28% | 29% |
Source: company-reported operating metrics [32] [33]. Click any linked figure to open the filing page with the row highlighted.
Analyst Consensus
Mean target
Median target
High target
Low target
Street ratings: 2 strong buy, 3 hold. Consensus: Buy.
Estimate source: S&P Capital IQ (CapIQ) consensus, as of 2026-07-29. Estimate figures are S&P Capital IQ consensus (vendor data — no filing page links). EPS and net income use the normalized (adjusted) consensus where the street reports it. Line-item analyst models (segments, drivers, KPIs) are in the Visible Alpha tab.
Traceability
501 of 527 figures on this page (95%) link to the filing page where they are printed — click a linked figure to open the source PDF at that page with the row highlighted. Unlinked figures come from standardized data feeds or pre-filing years.
All figures are in US$ thousands, the scale the company prints on its financial statements (“Amounts in thousands, except per share data”). Per-share amounts and percentages are as printed.
Each fiscal year is cited to that year's own Form 10-K, so every figure in the FY2021-FY2025 columns is a first-column (current-year) figure on the cited page rather than a comparative.
Lancaster Colony Corporation was renamed The Marzetti Company effective June 27, 2025; the FY2021-FY2024 Forms 10-K are filed under the Lancaster Colony name. The fiscal year ends June 30.
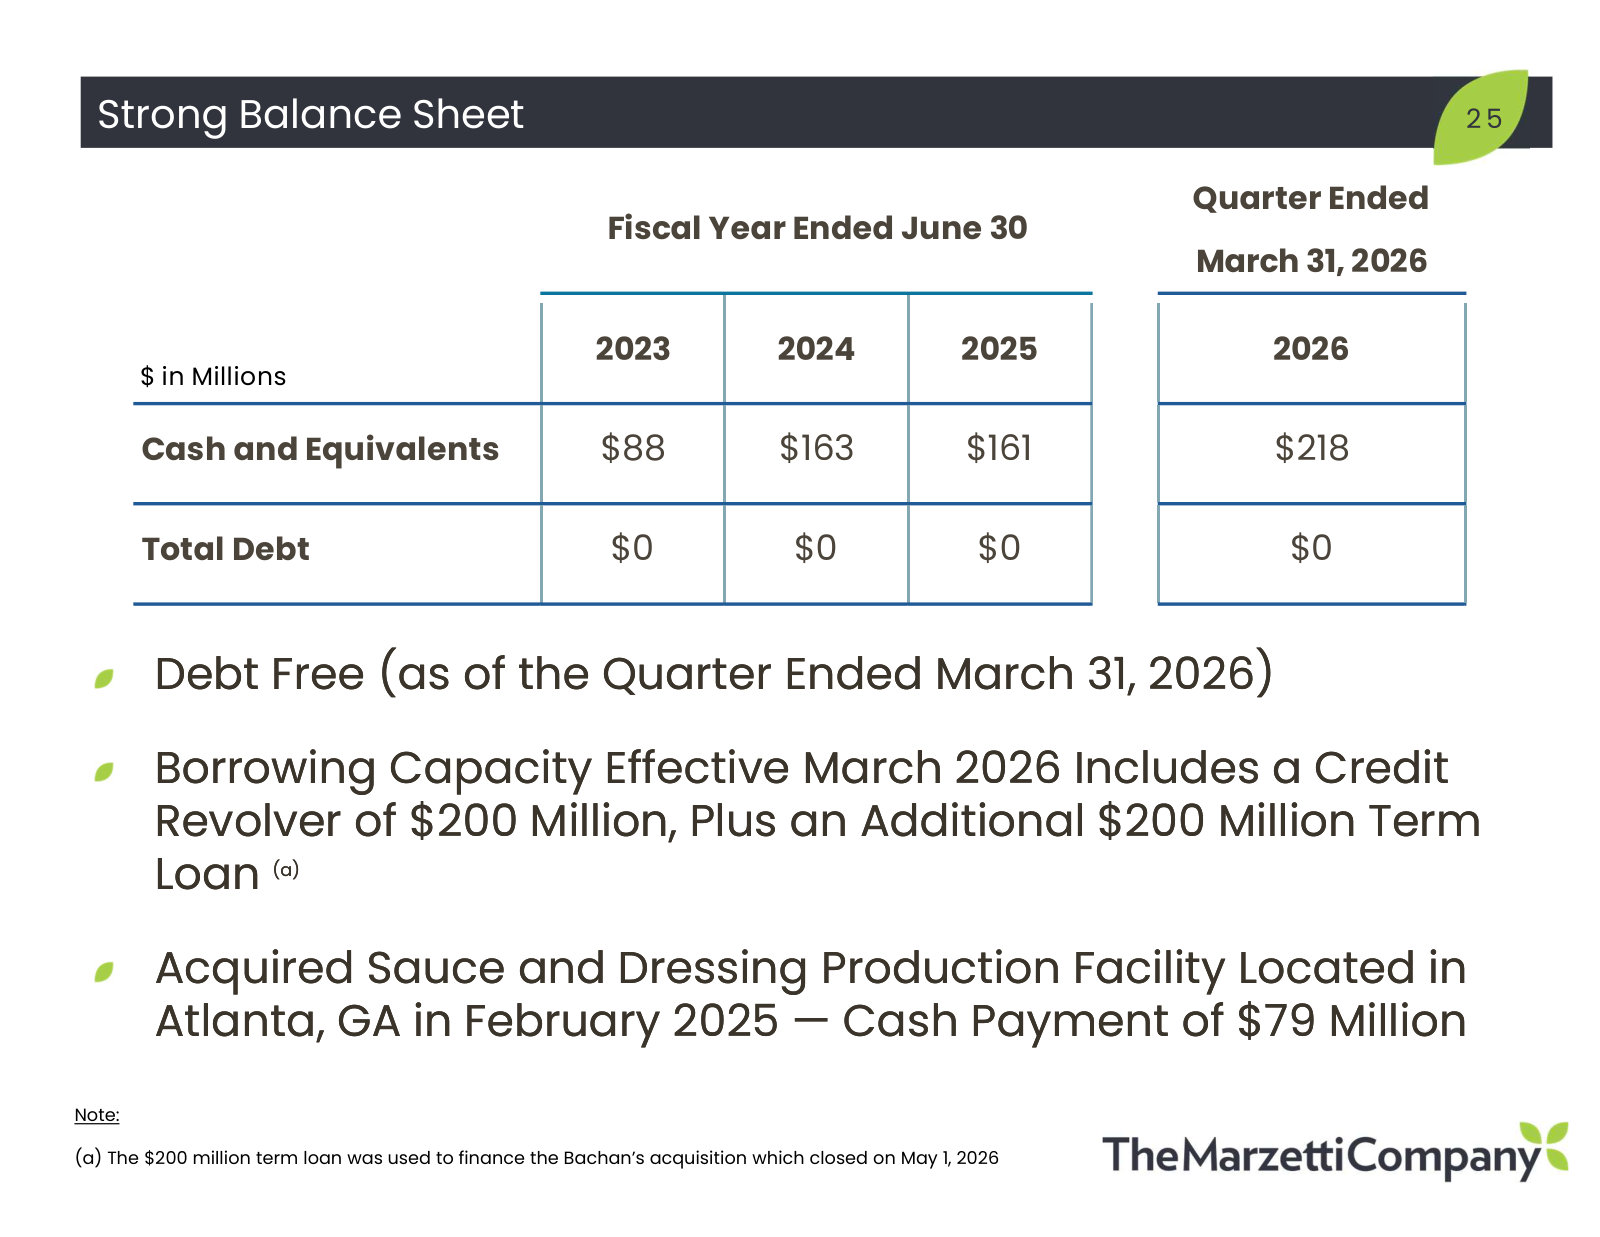
The company carried no outstanding borrowings on its revolving credit facility at any June 30 balance-sheet date shown, so no debt line appears on the balance sheet.
Cash-flow outflows (property additions, dividends, treasury purchases, acquisitions) are shown negative, exactly as printed in parentheses in the filings. Where the standardized feed supplies an unlinked long-term figure (FY2017-FY2018 capital expenditures) the sign has been normalized to match.
Rows printed as an em dash (nil) in a given year - Change in Contingent Consideration in FY2023 and FY2024, Other roll products from FY2022, Other dressings and sauces for TSA before FY2025, Cash paid for acquisition in FY2021-FY2024 - are carried as zero and left unlinked, because an em dash is not a useful highlight anchor.
The Pension Settlement Charge line (FY2025) and the Other intangible assets-net line (retired after FY2024) exist only in the years shown; other years are null because the filings do not print the line.
FY2017-FY2018 figures in the Long-Term Record come from the standardized SEC XBRL feed and are shown without page links; FY2016 is excluded because the feed carries no net sales figure for that year.
The quarterly block covers the six fiscal quarters for which the corpus holds a Form 10-Q. US filers publish no fourth-quarter 10-Q, so the June quarters of FY2025 and FY2026 are absent by construction rather than omitted - the standardized quarterly feed has the same gap.
Every derived quarterly cash-flow cell reconciles exactly to the difference of the two printed year-to-date figures and was cross-checked against data/financials/cash_flow_quarterly.json, which agrees to the dollar in every case.
No discrepancies: every figure taken from the filings was reconciled against the standardized feed (income.json, balance_sheet.json, cash_flow.json, segment.json, cash_flow_quarterly.json) and the two agree on every cell tested, so the discrepancies list is empty.
The Marzetti Company's management explains the business in its own materials. The slides below do the most of that work, pulled from the documents preserved in Sources. Each source link opens the complete presentation at that slide in a new tab.
Investor Presentation - June 2026 — June 2026
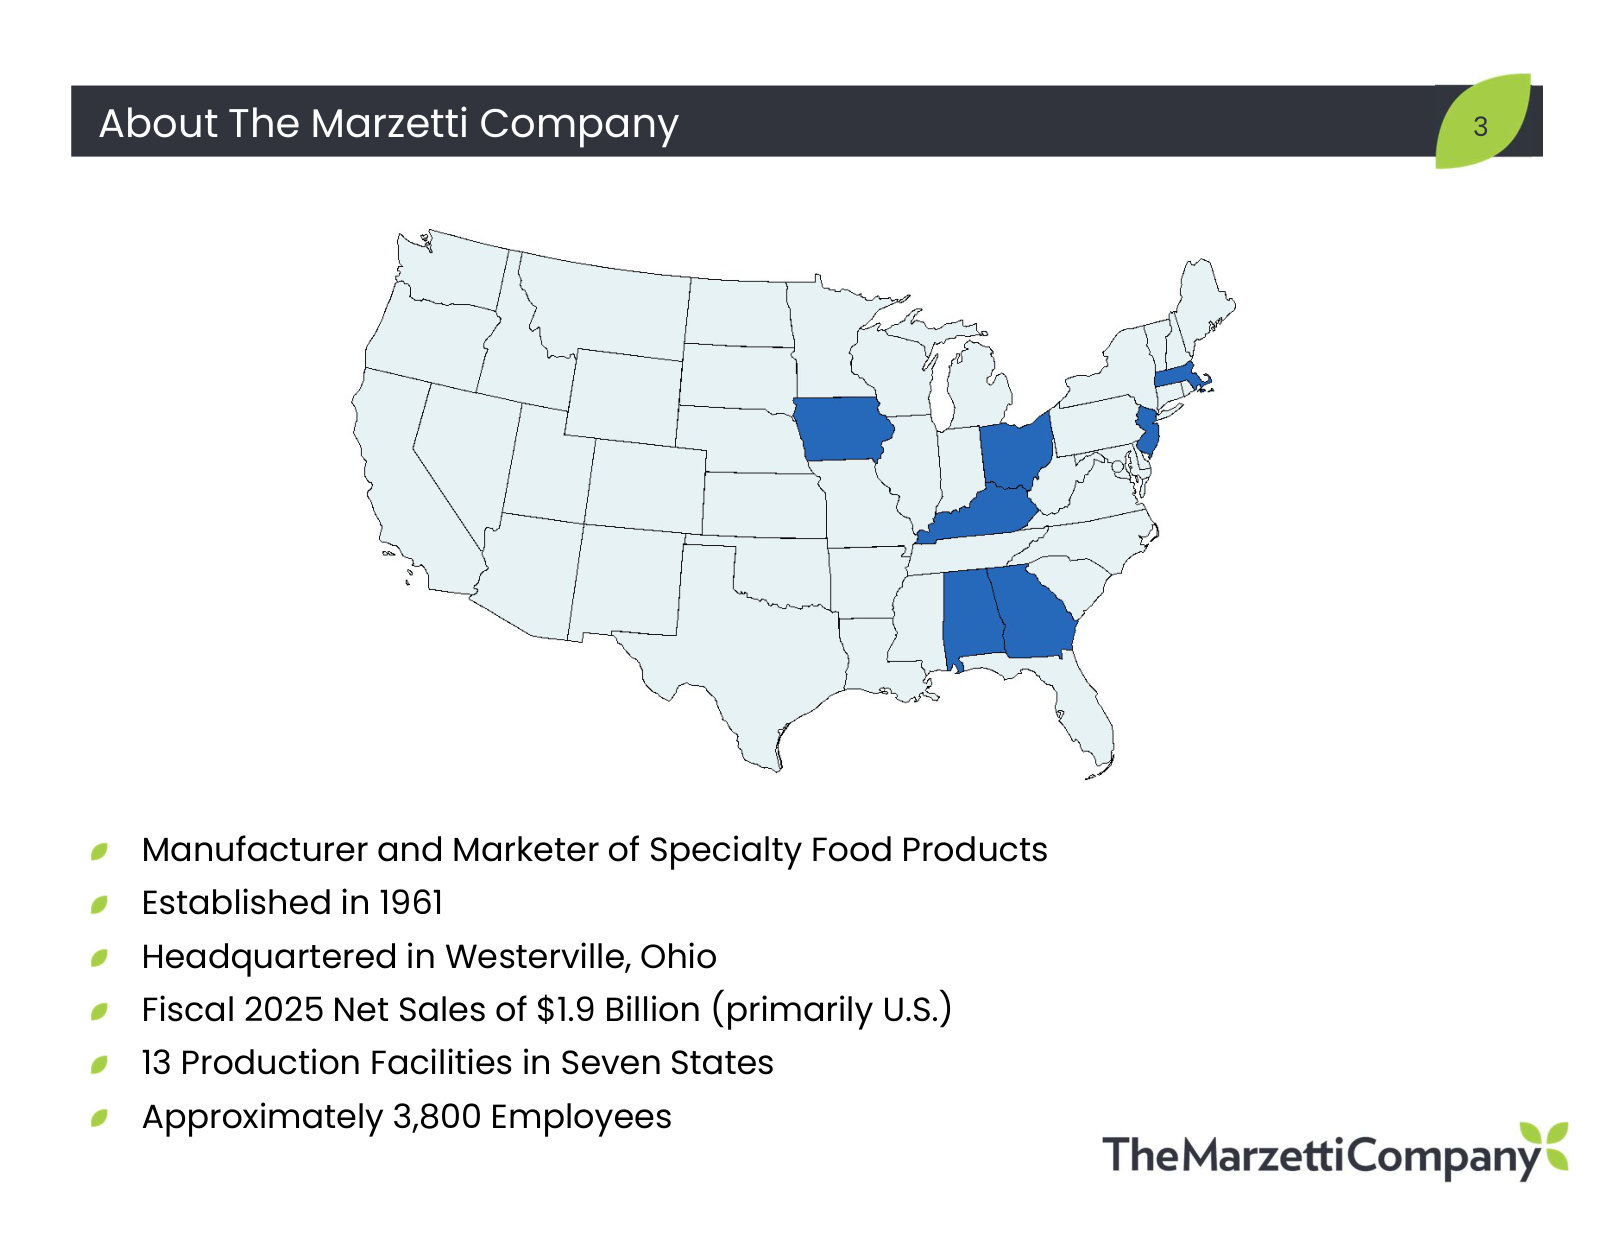
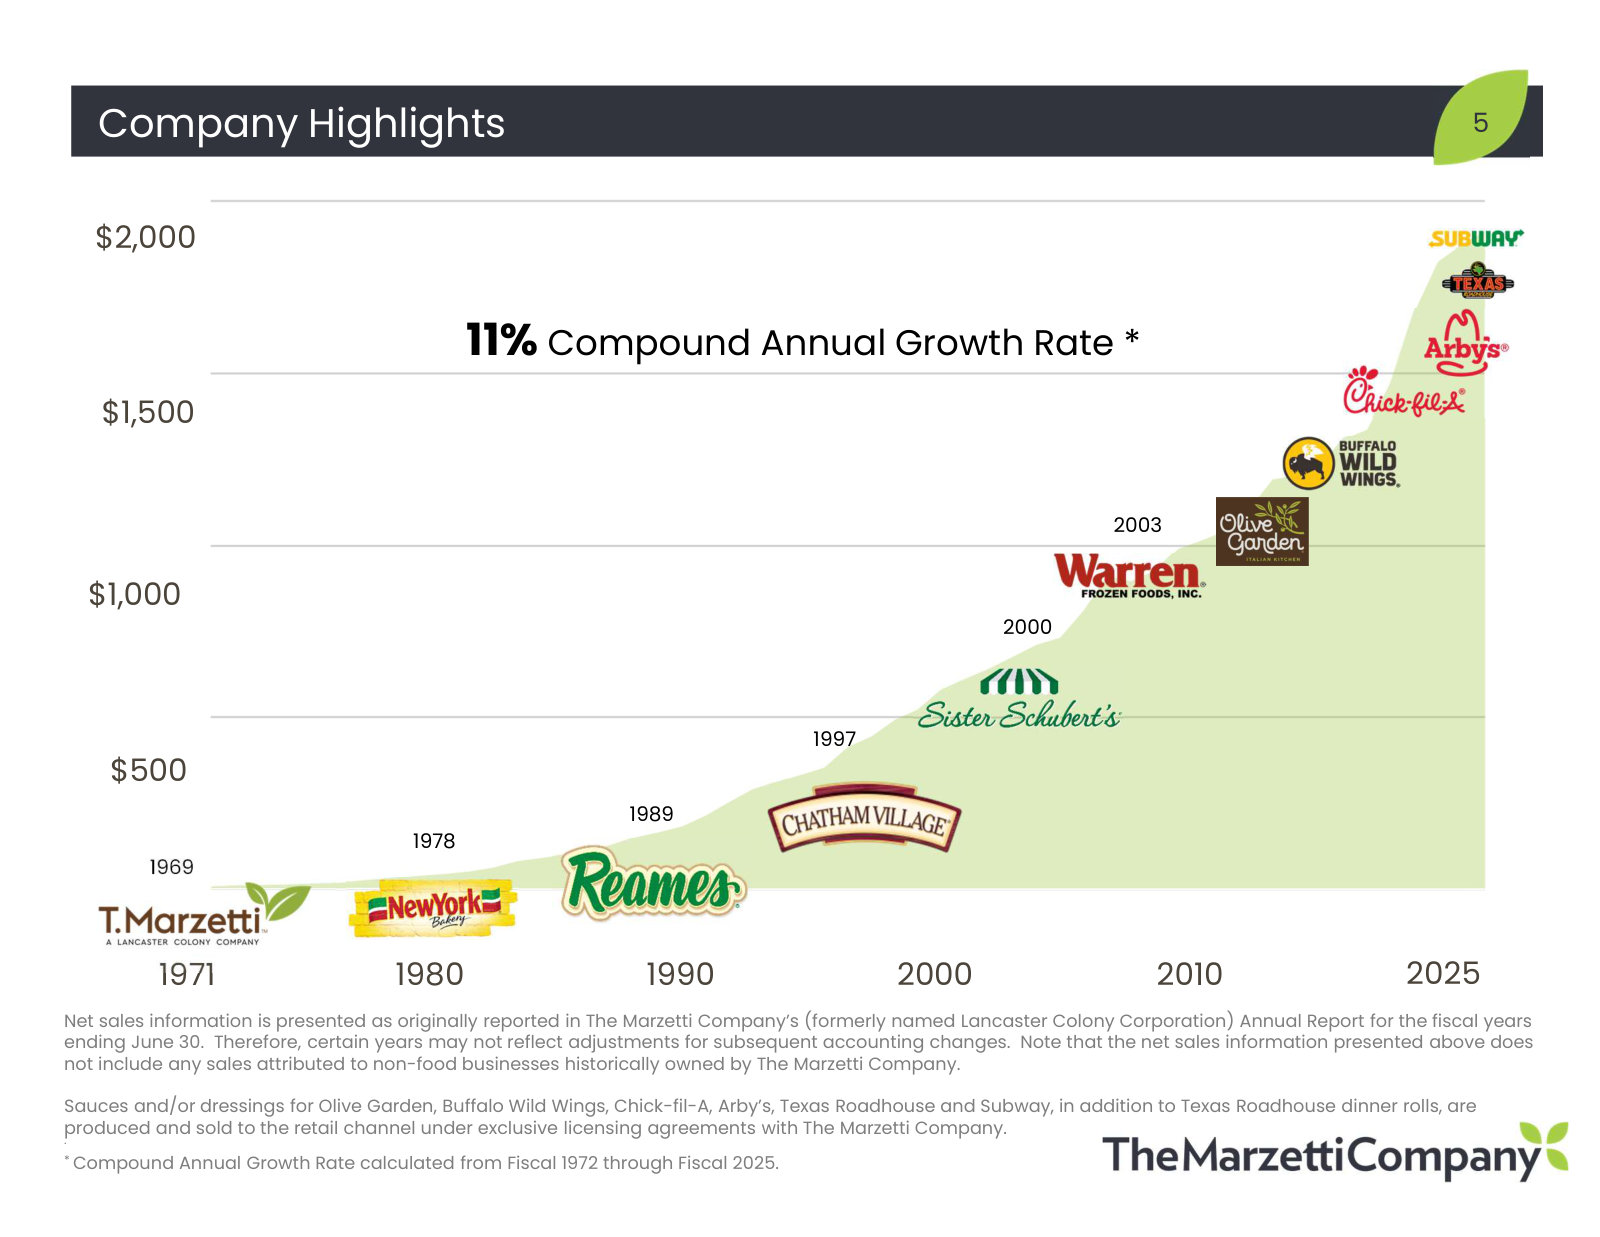
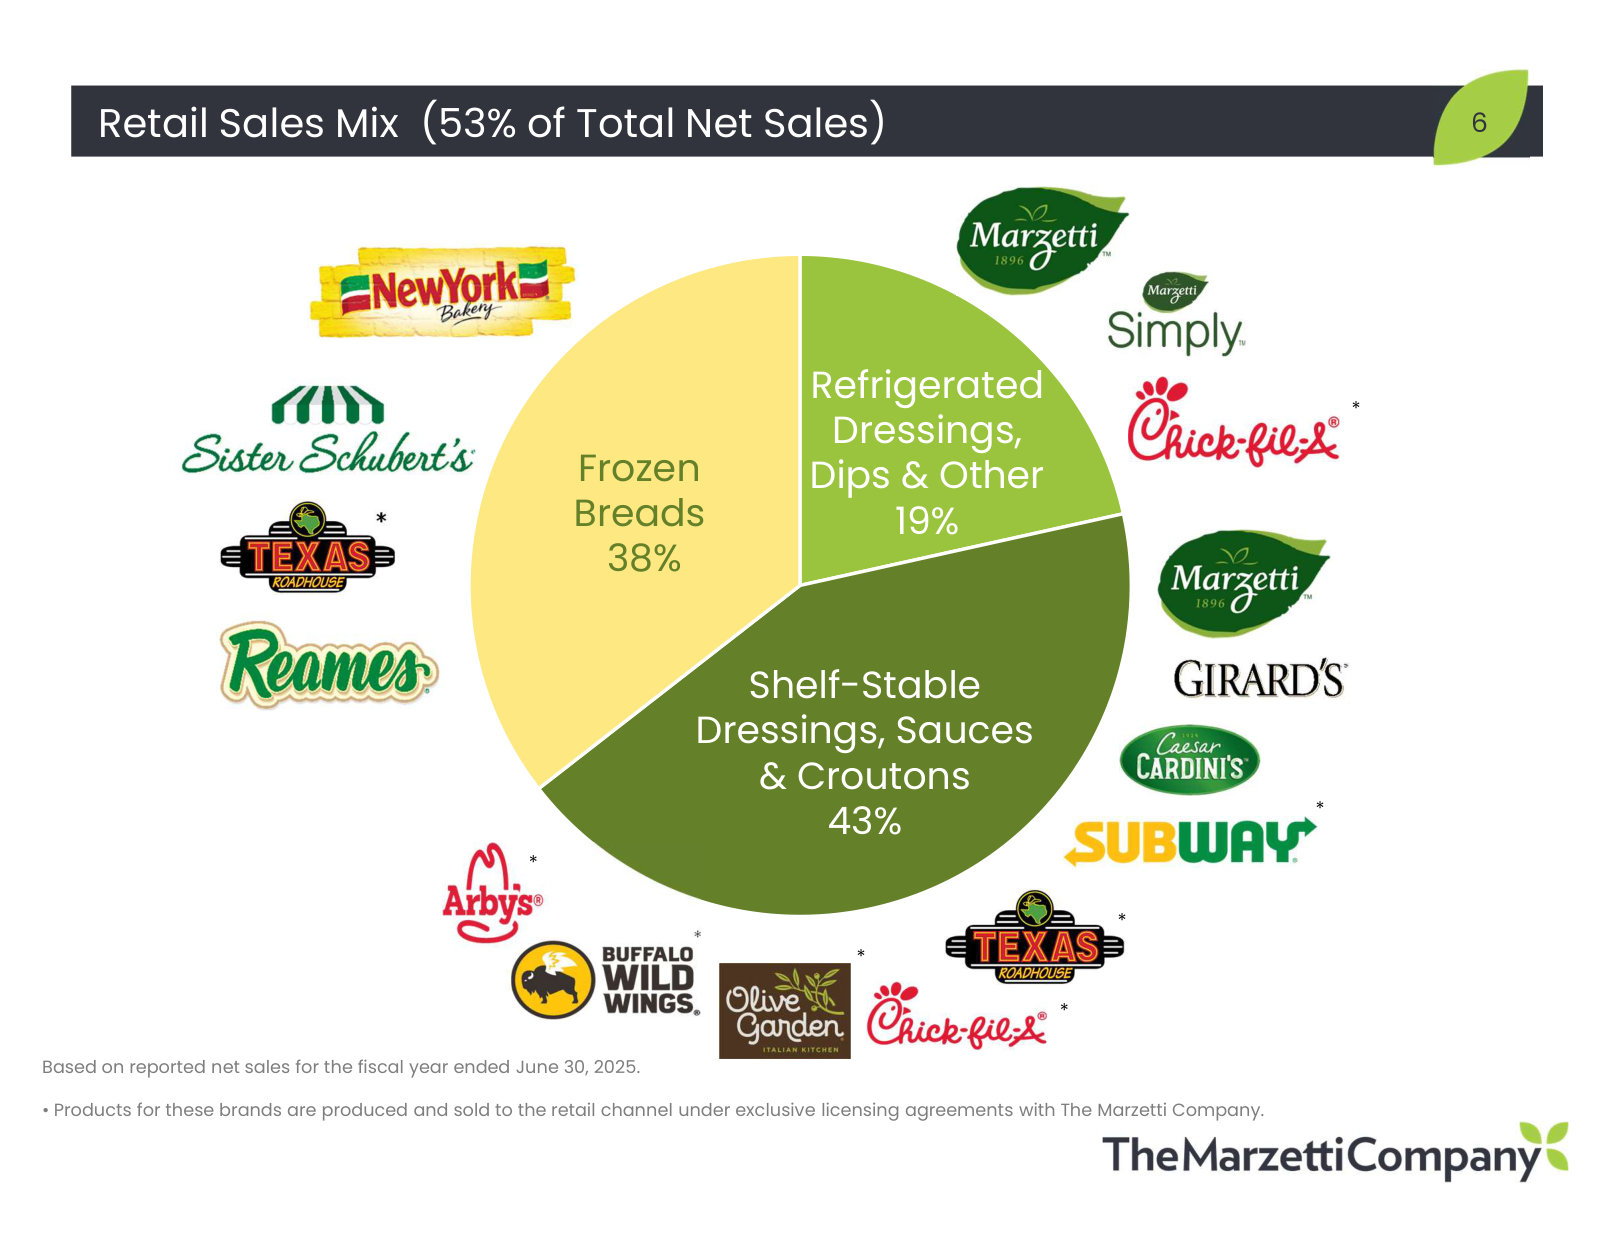
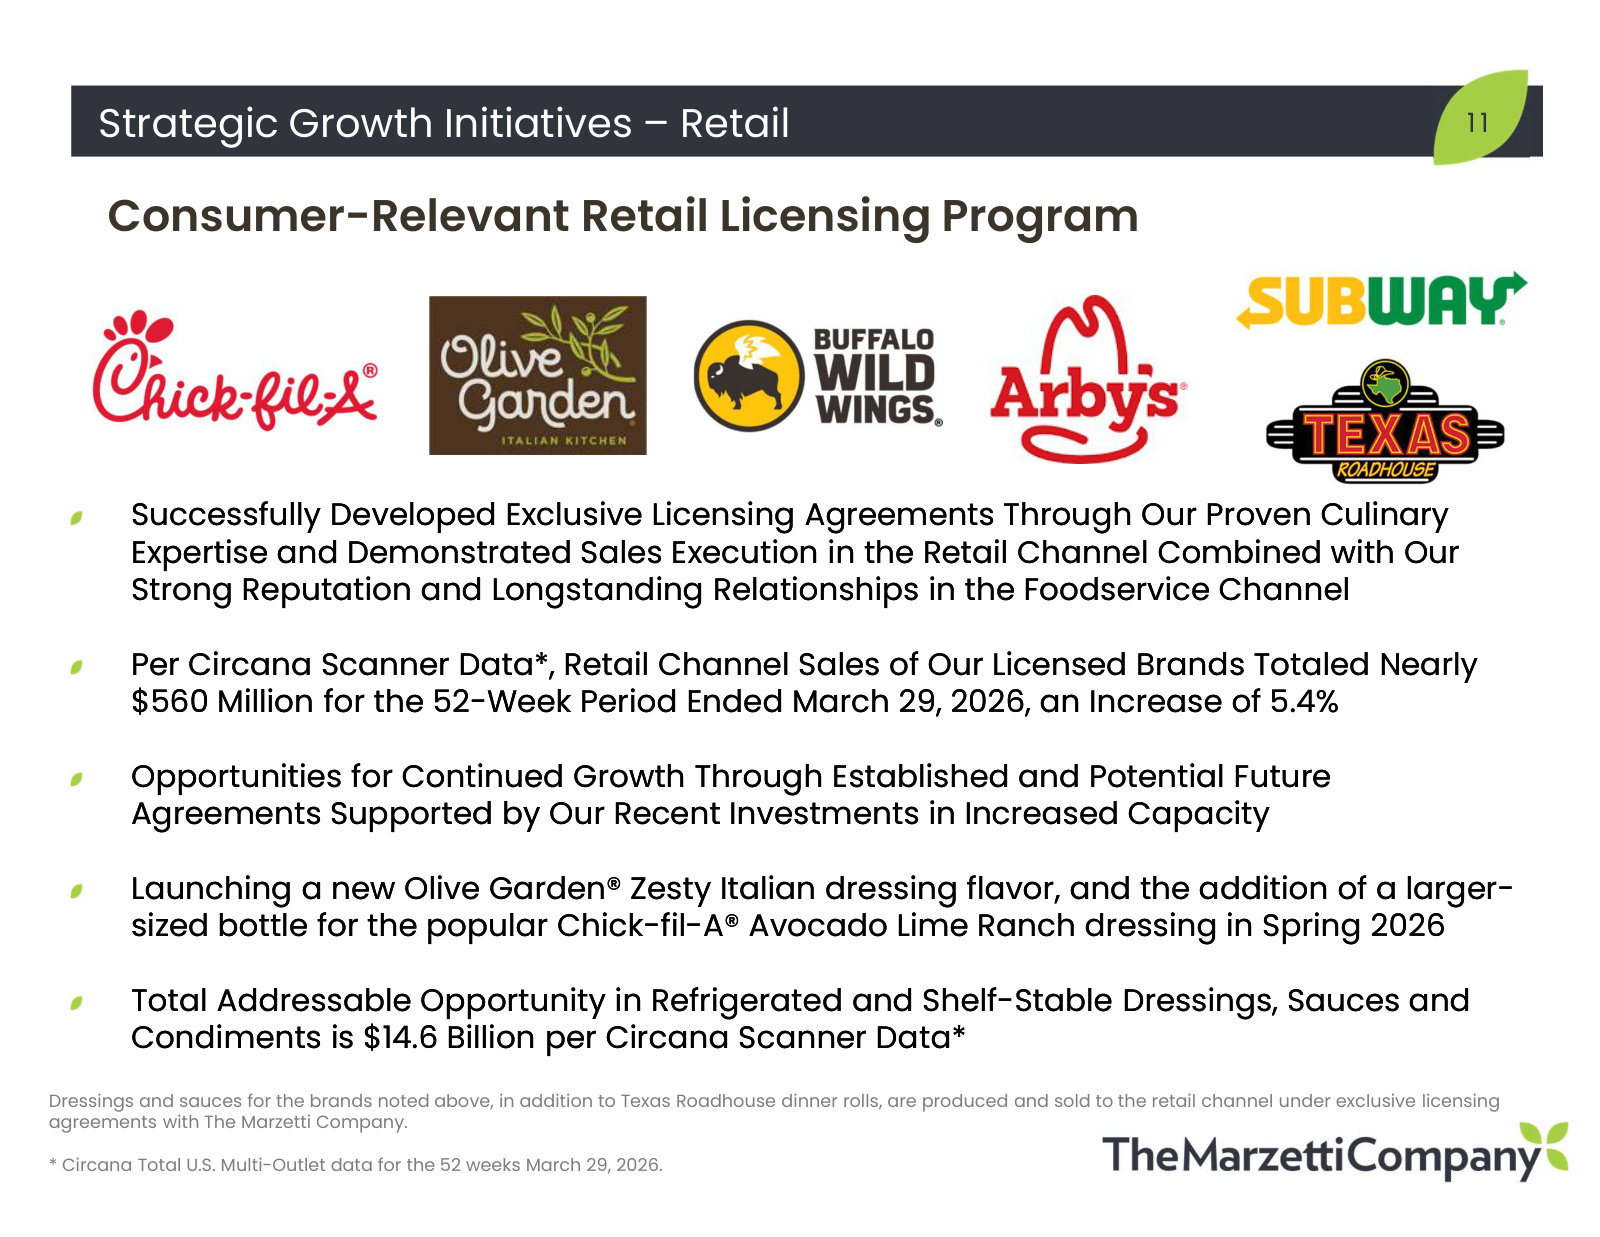
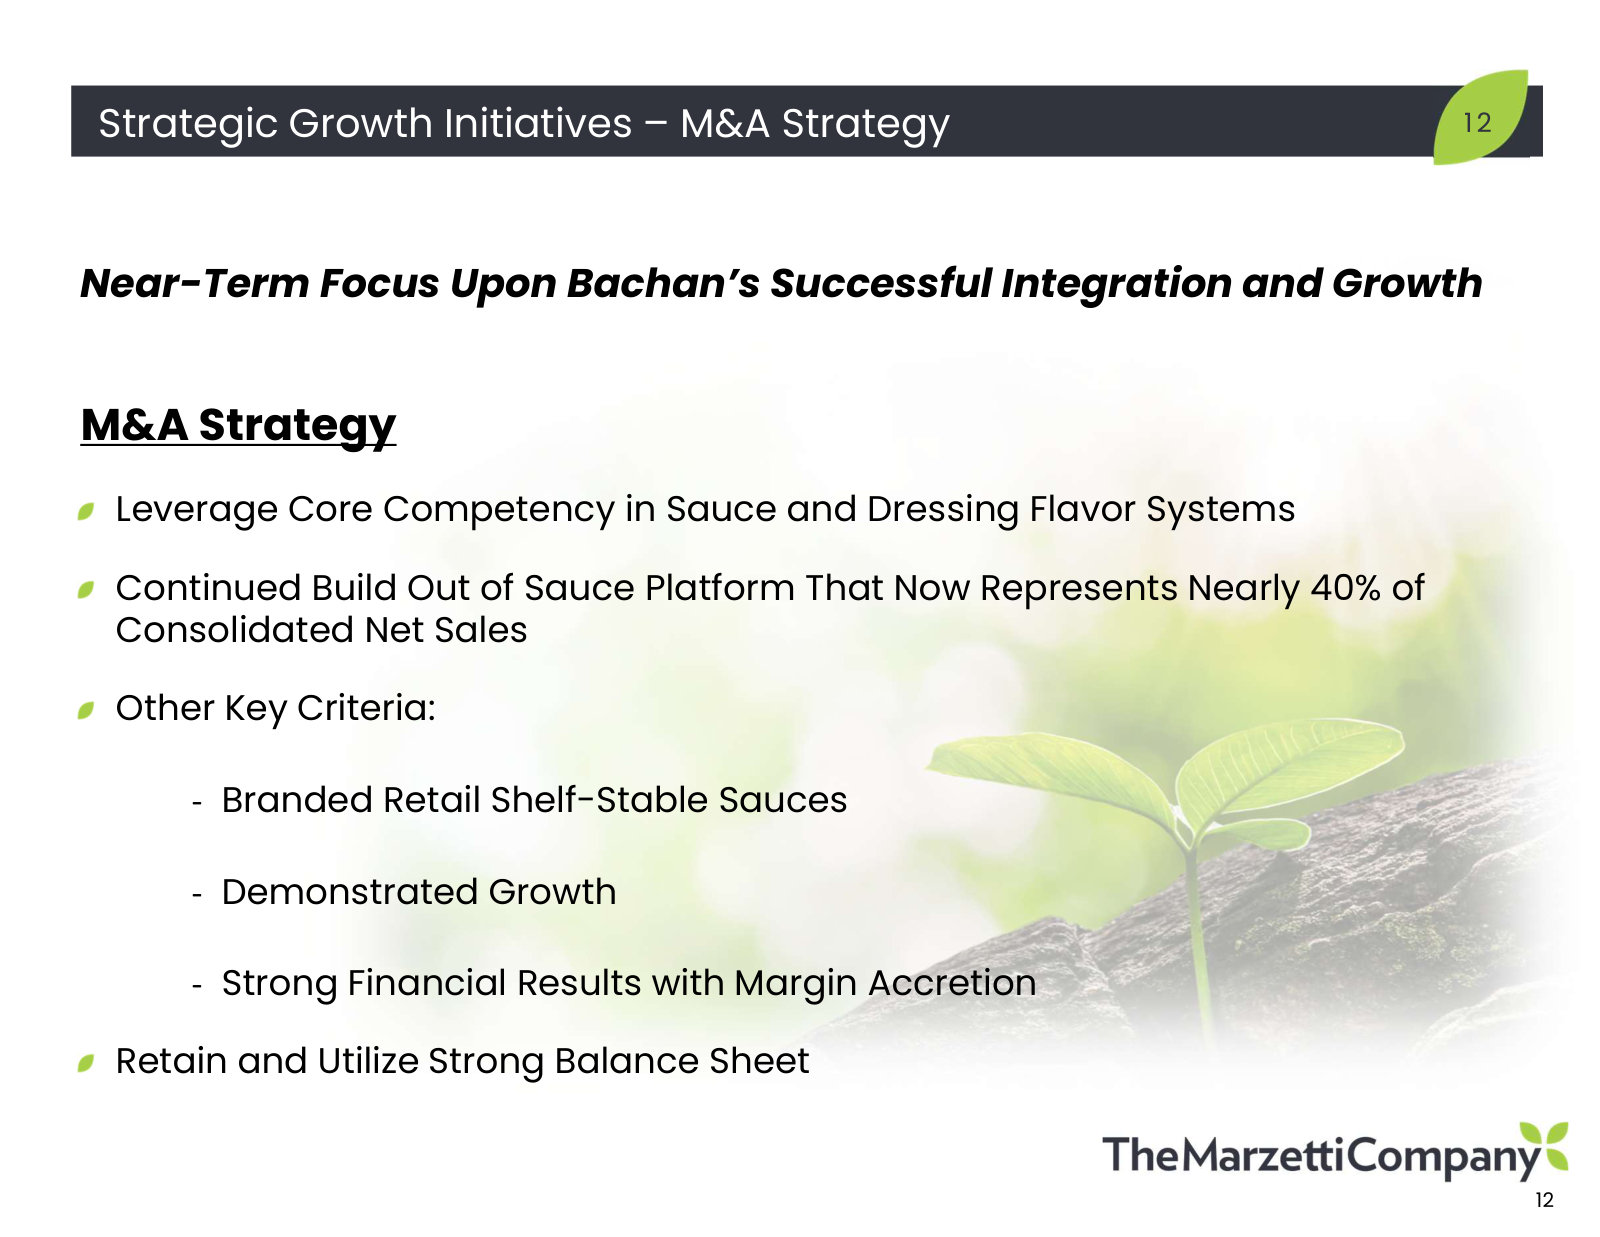
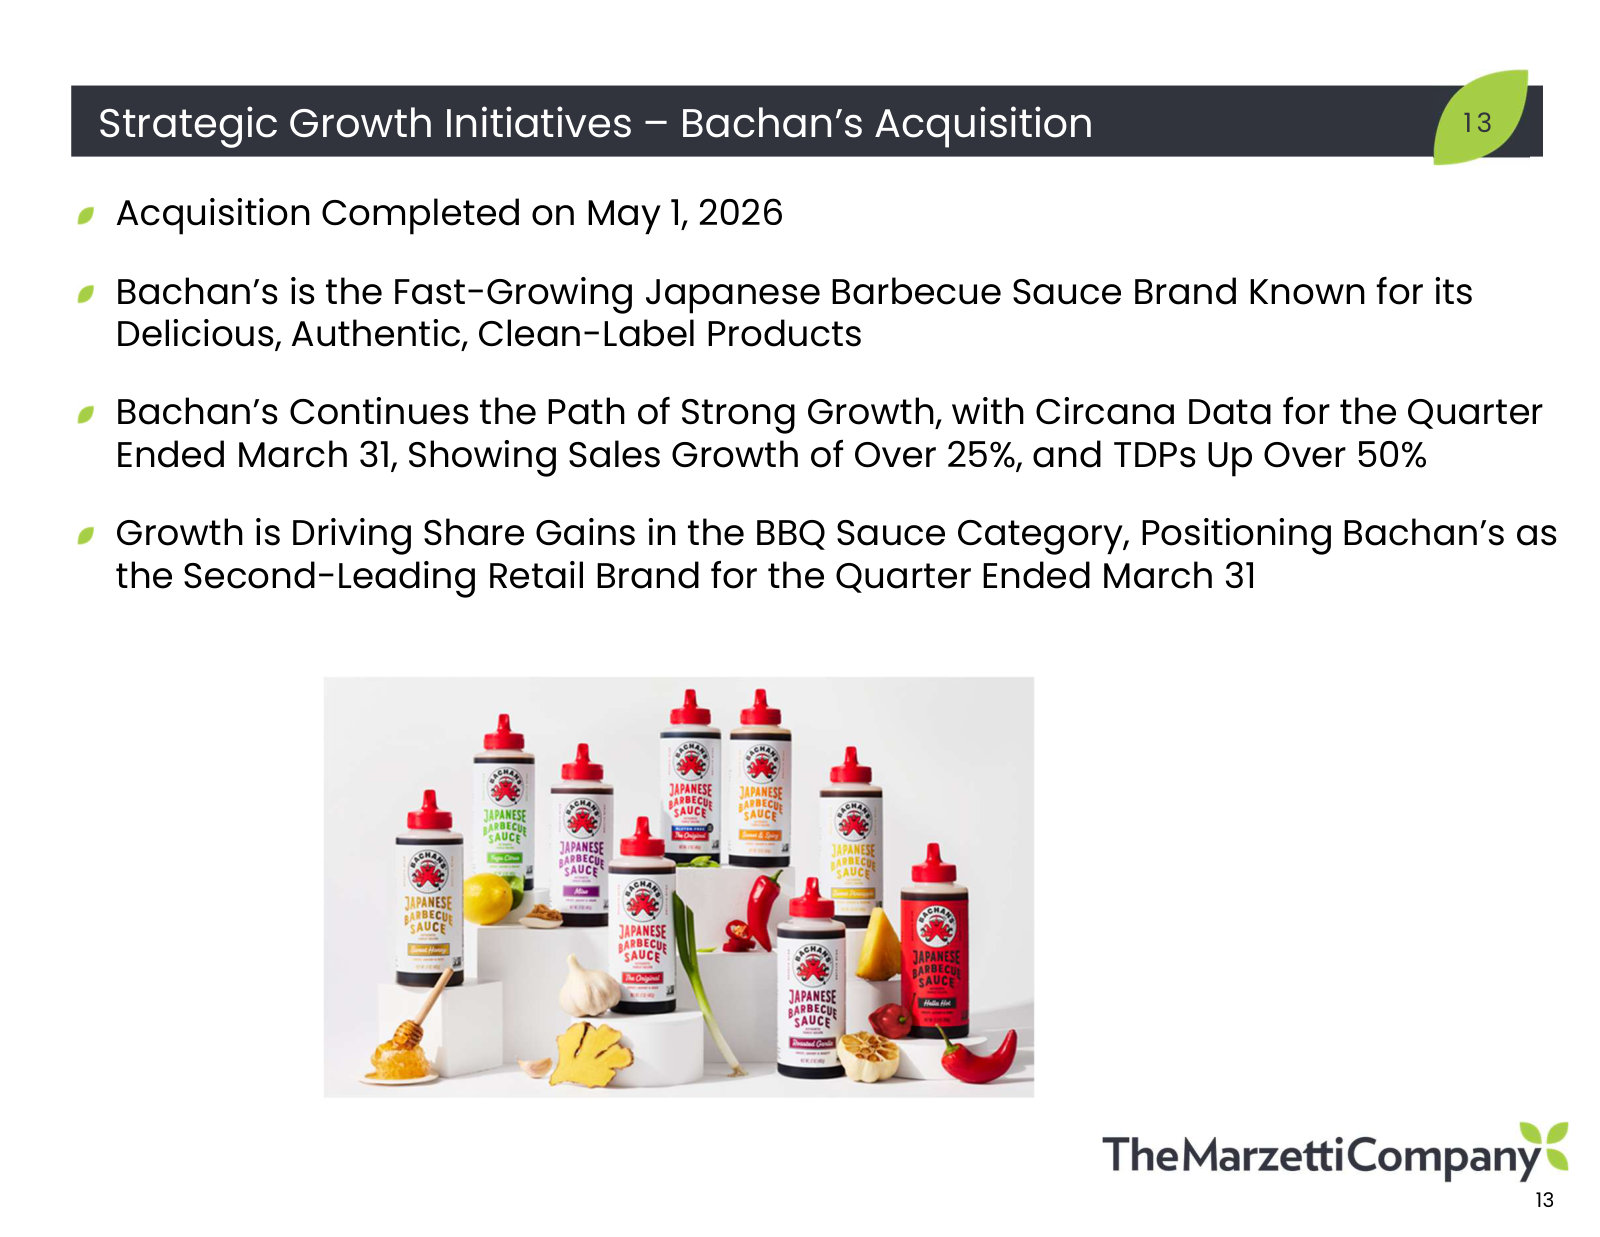
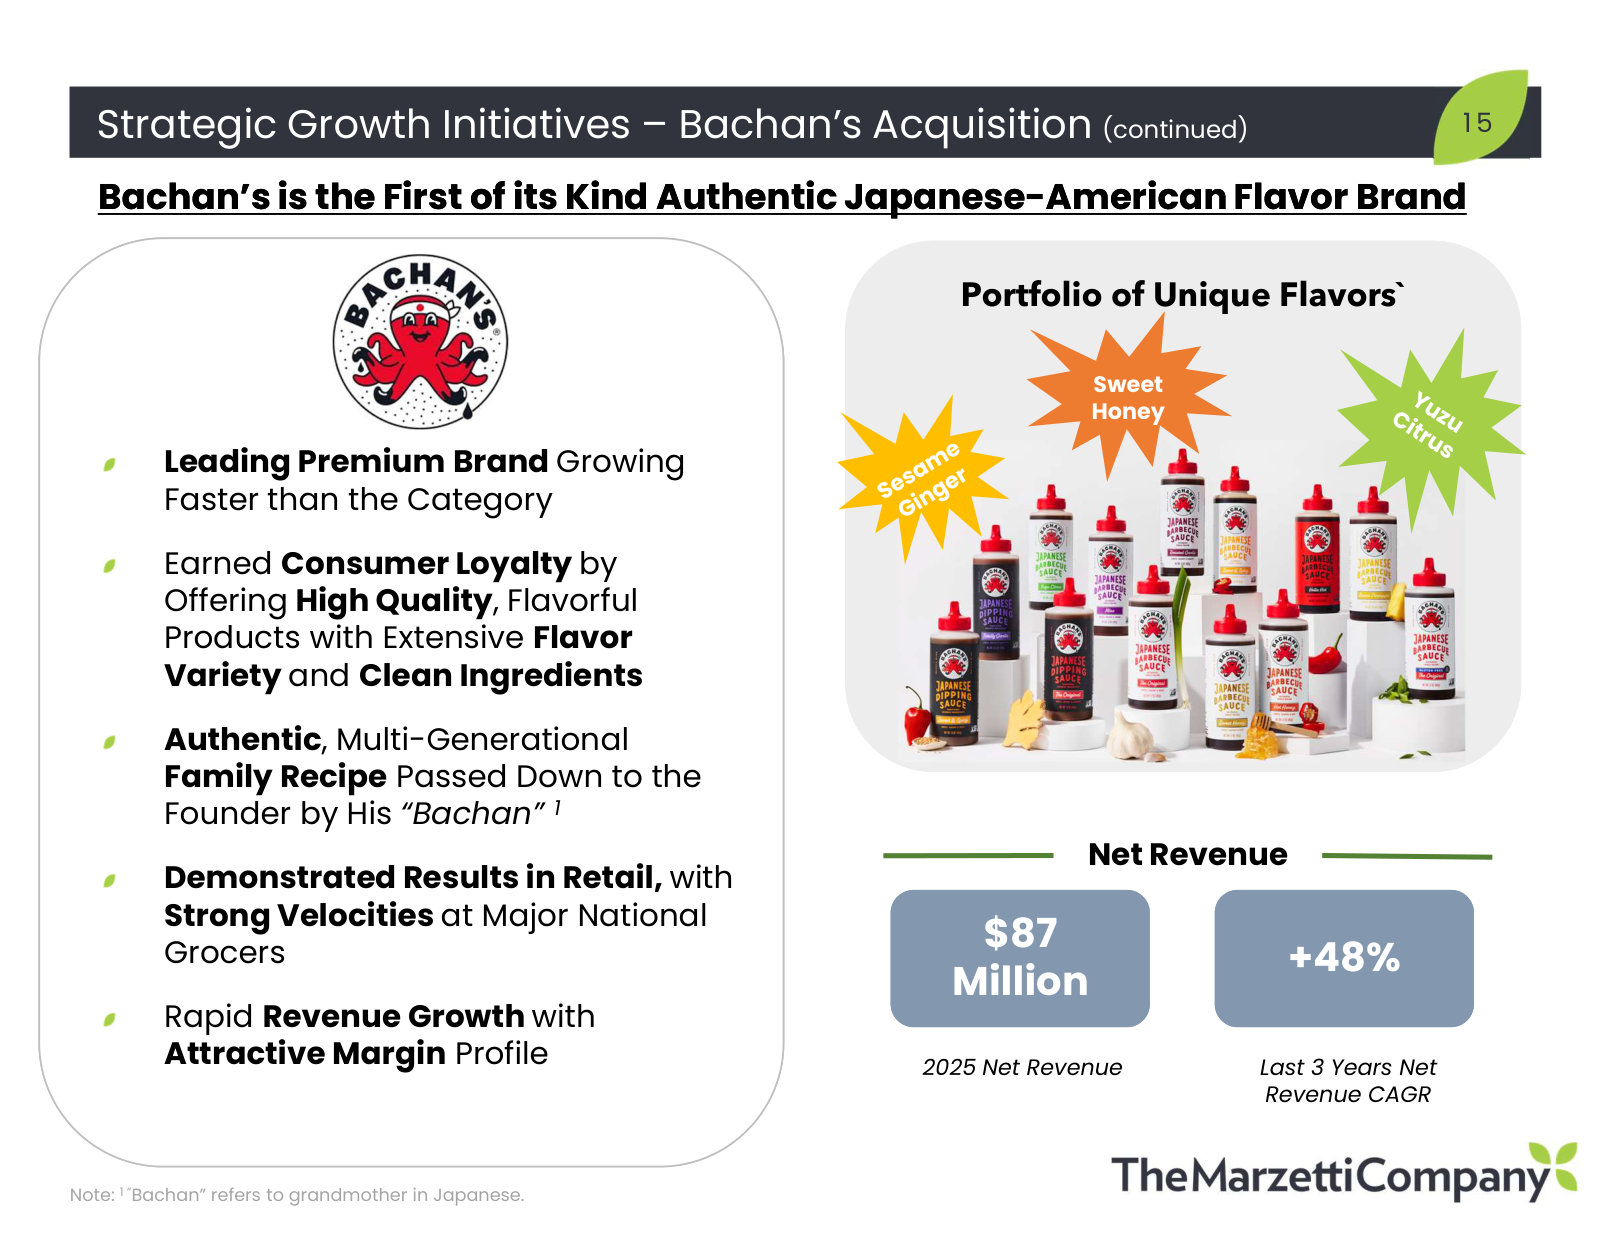
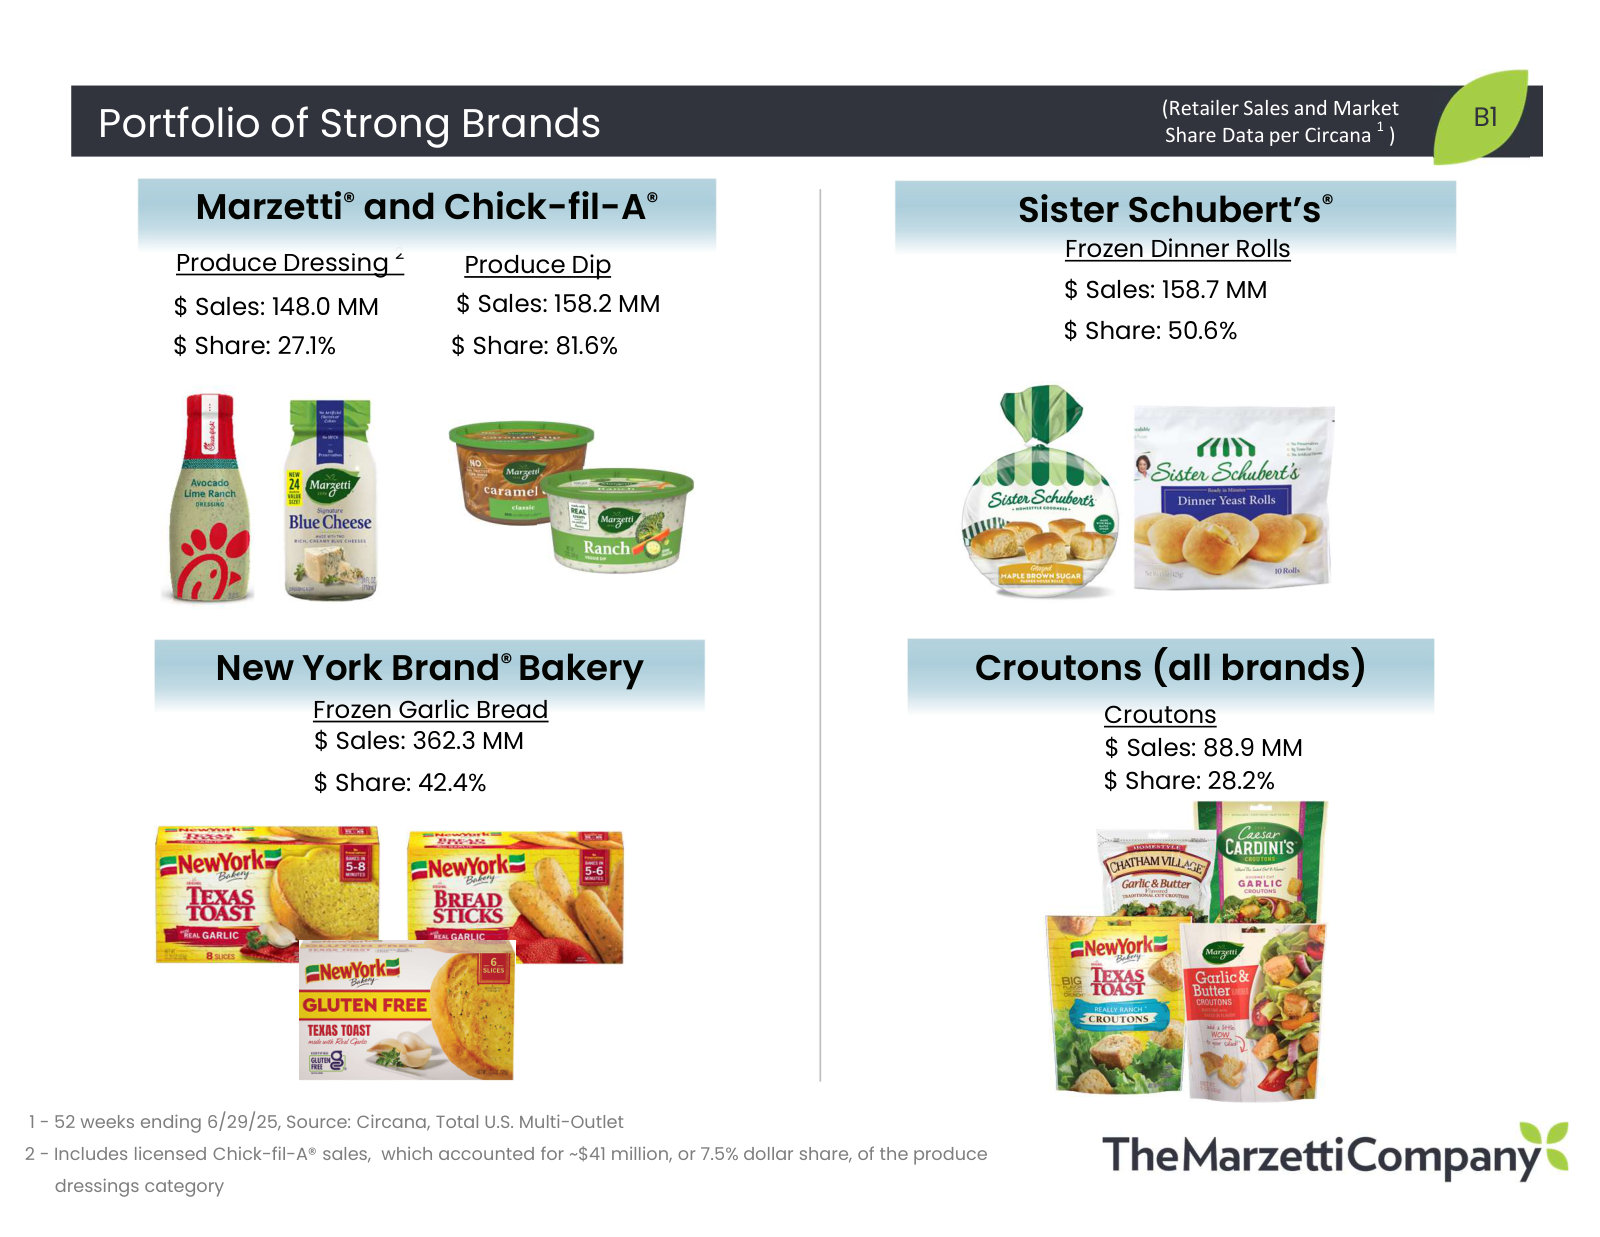
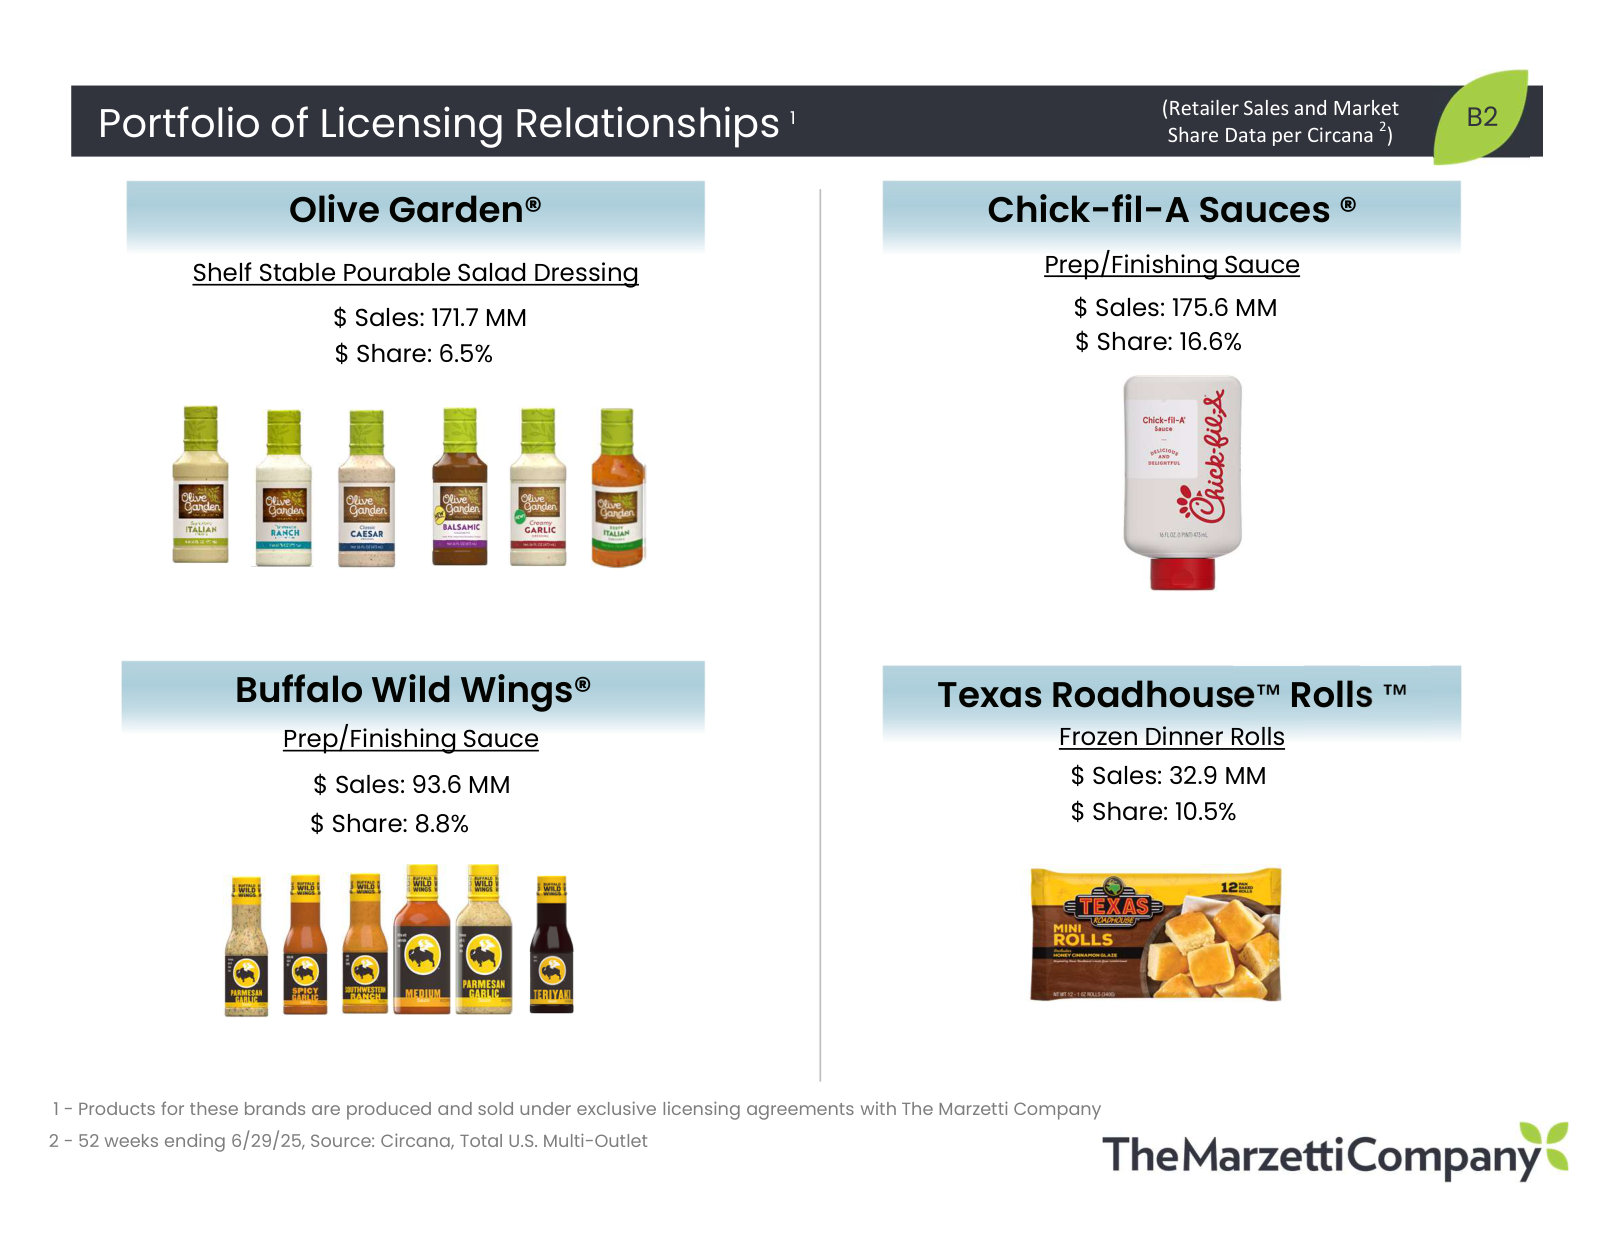
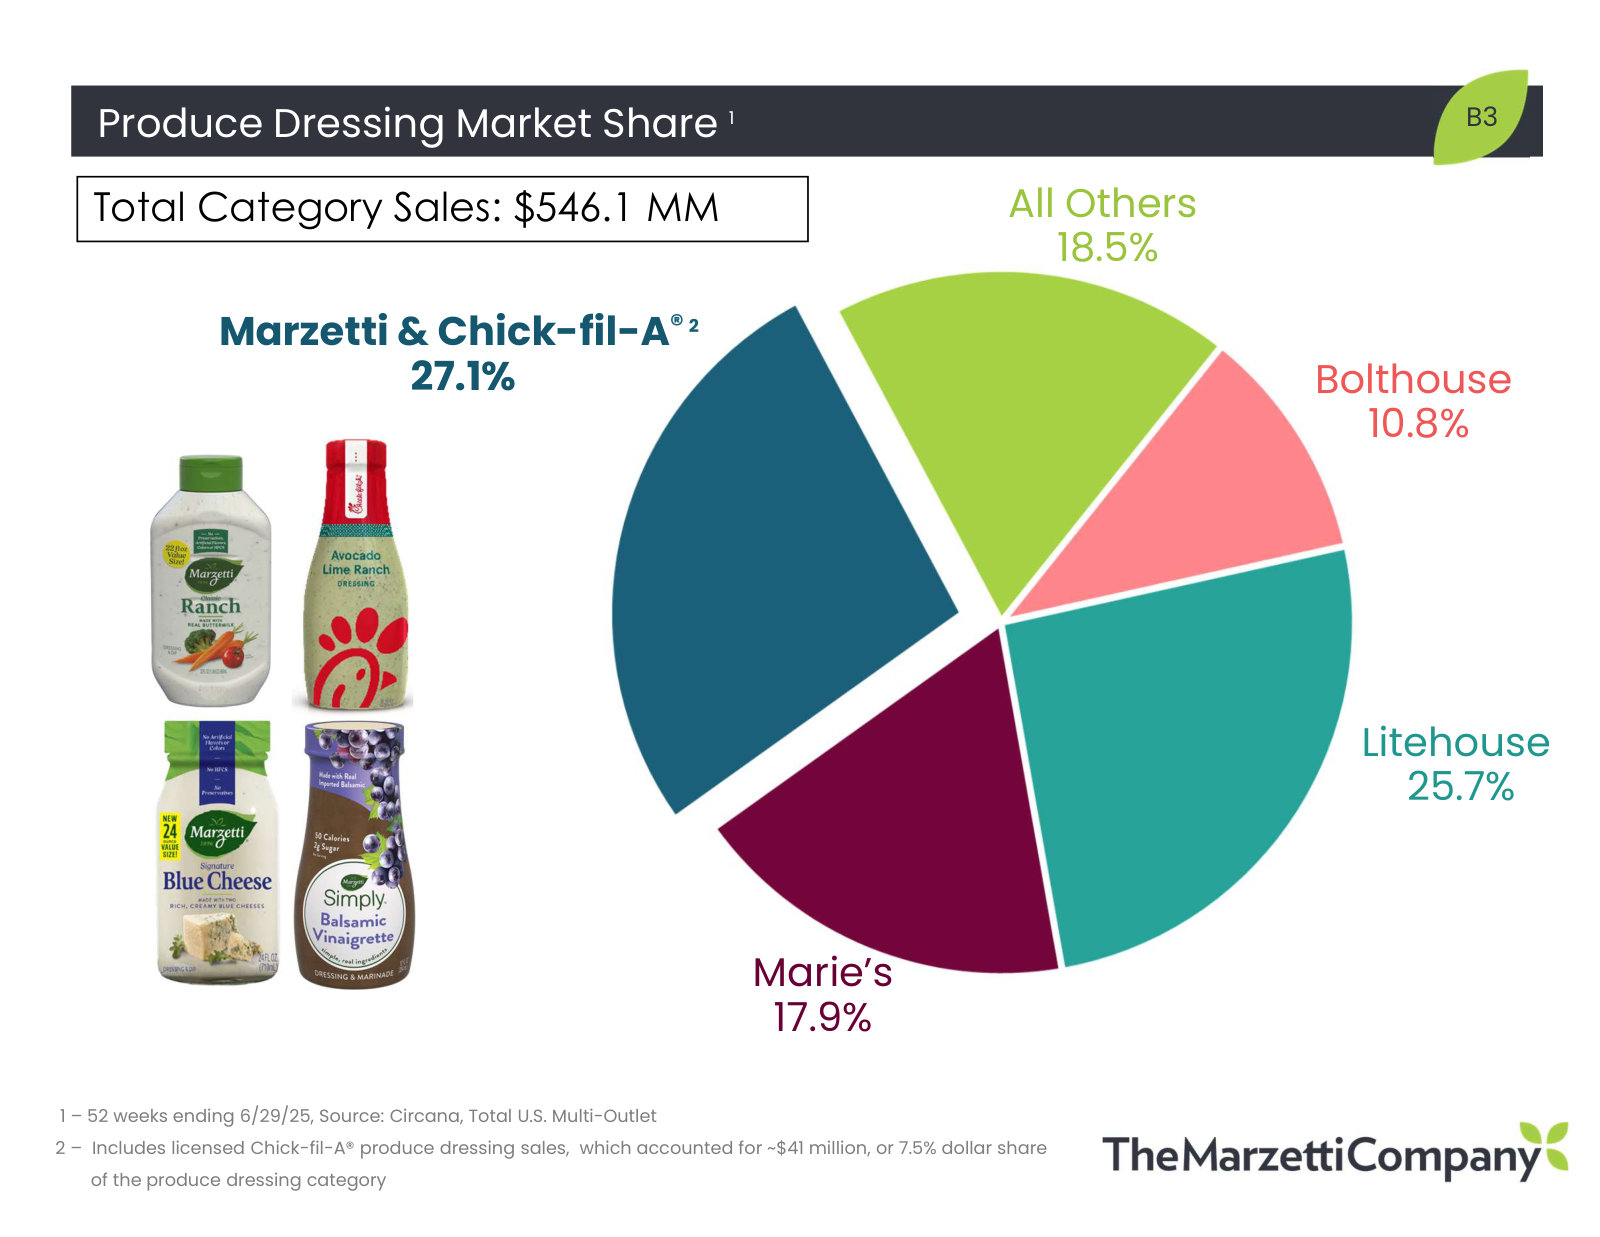
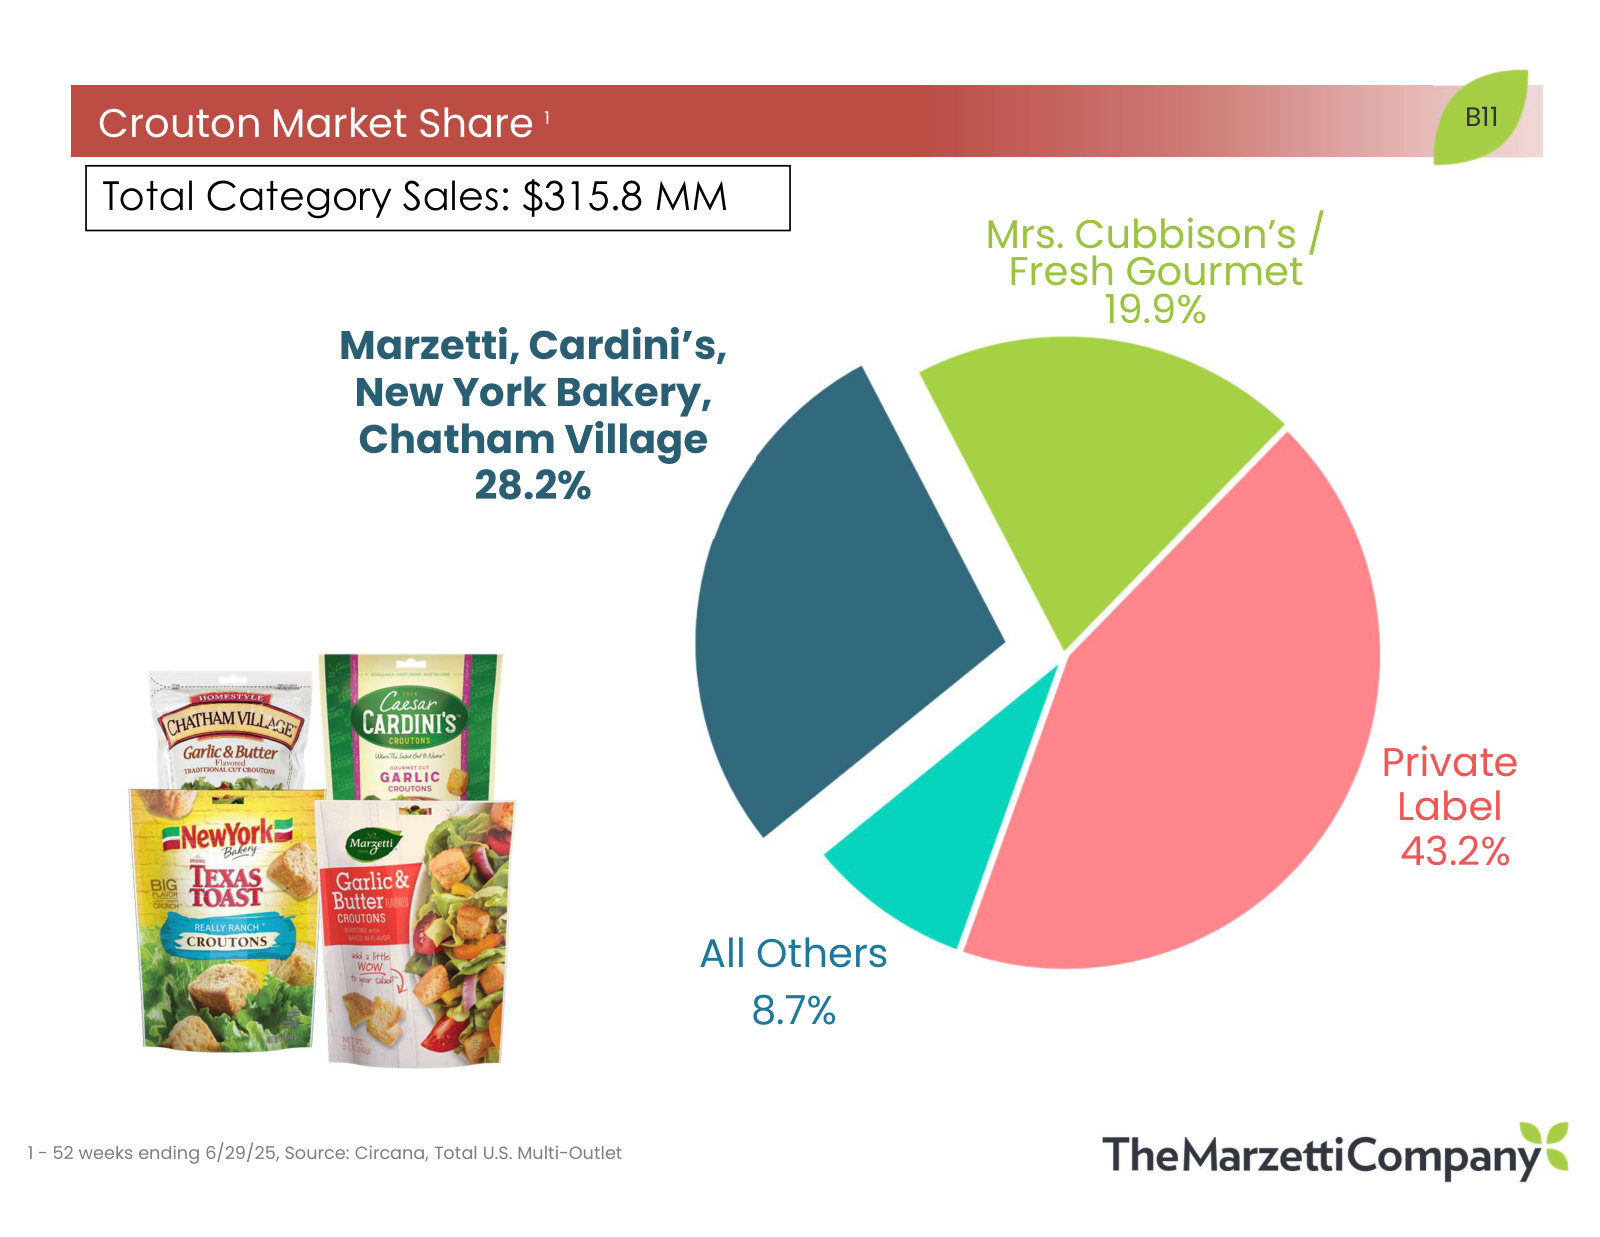
The current overview deck: what Marzetti makes, how its two segments earn money, the licensing and M&A strategy, and category share data. · Open the full document →
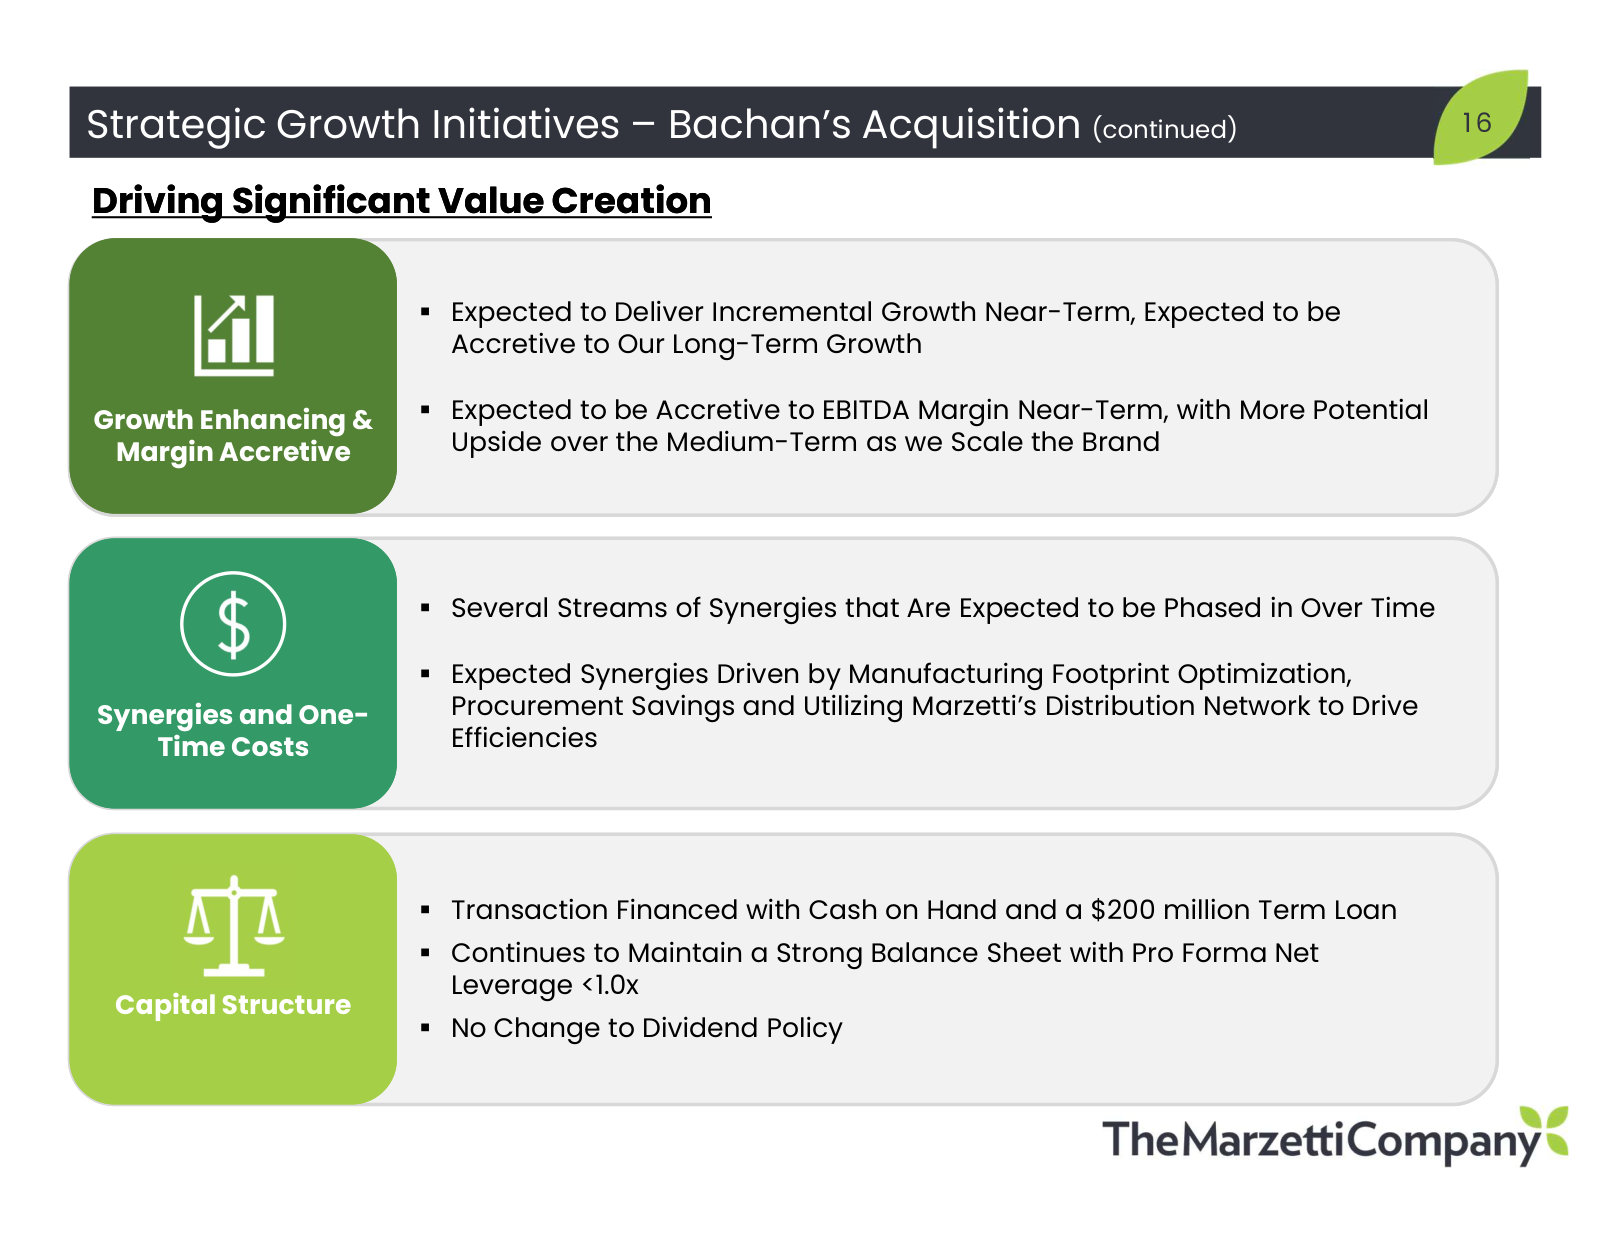
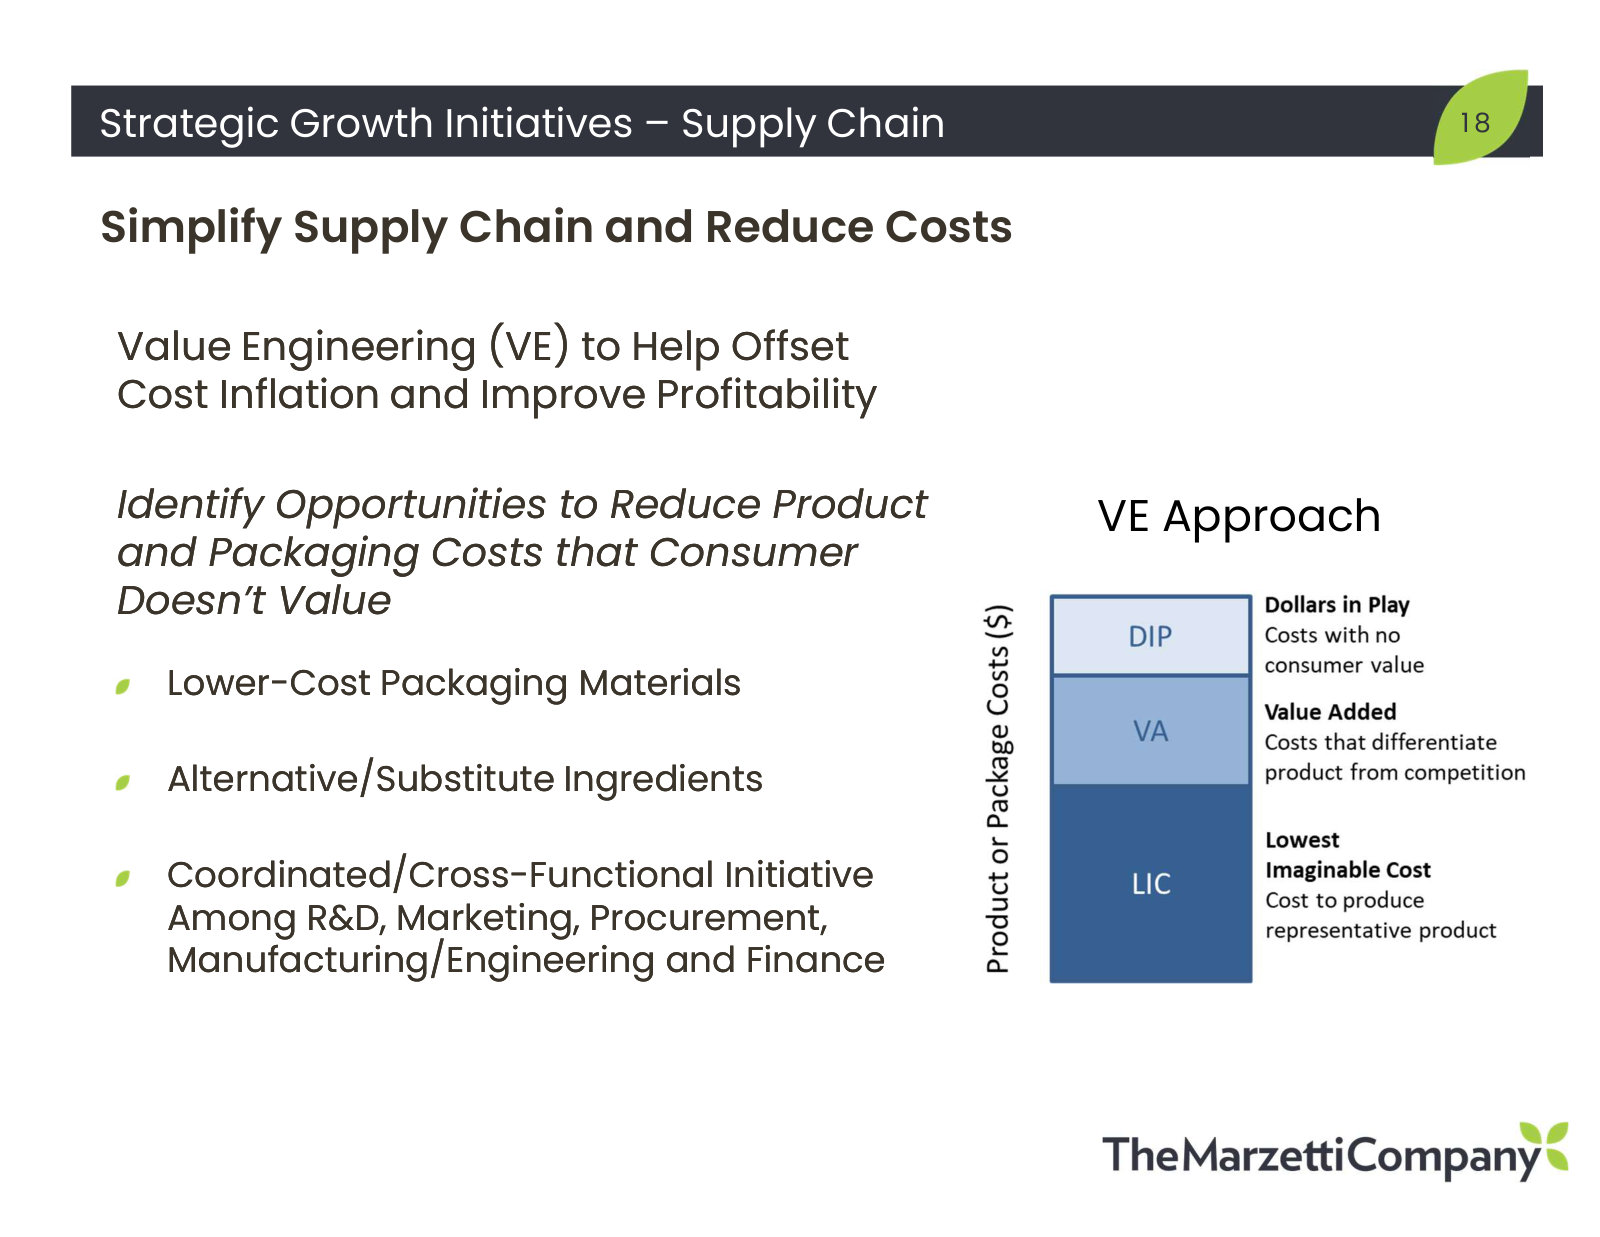
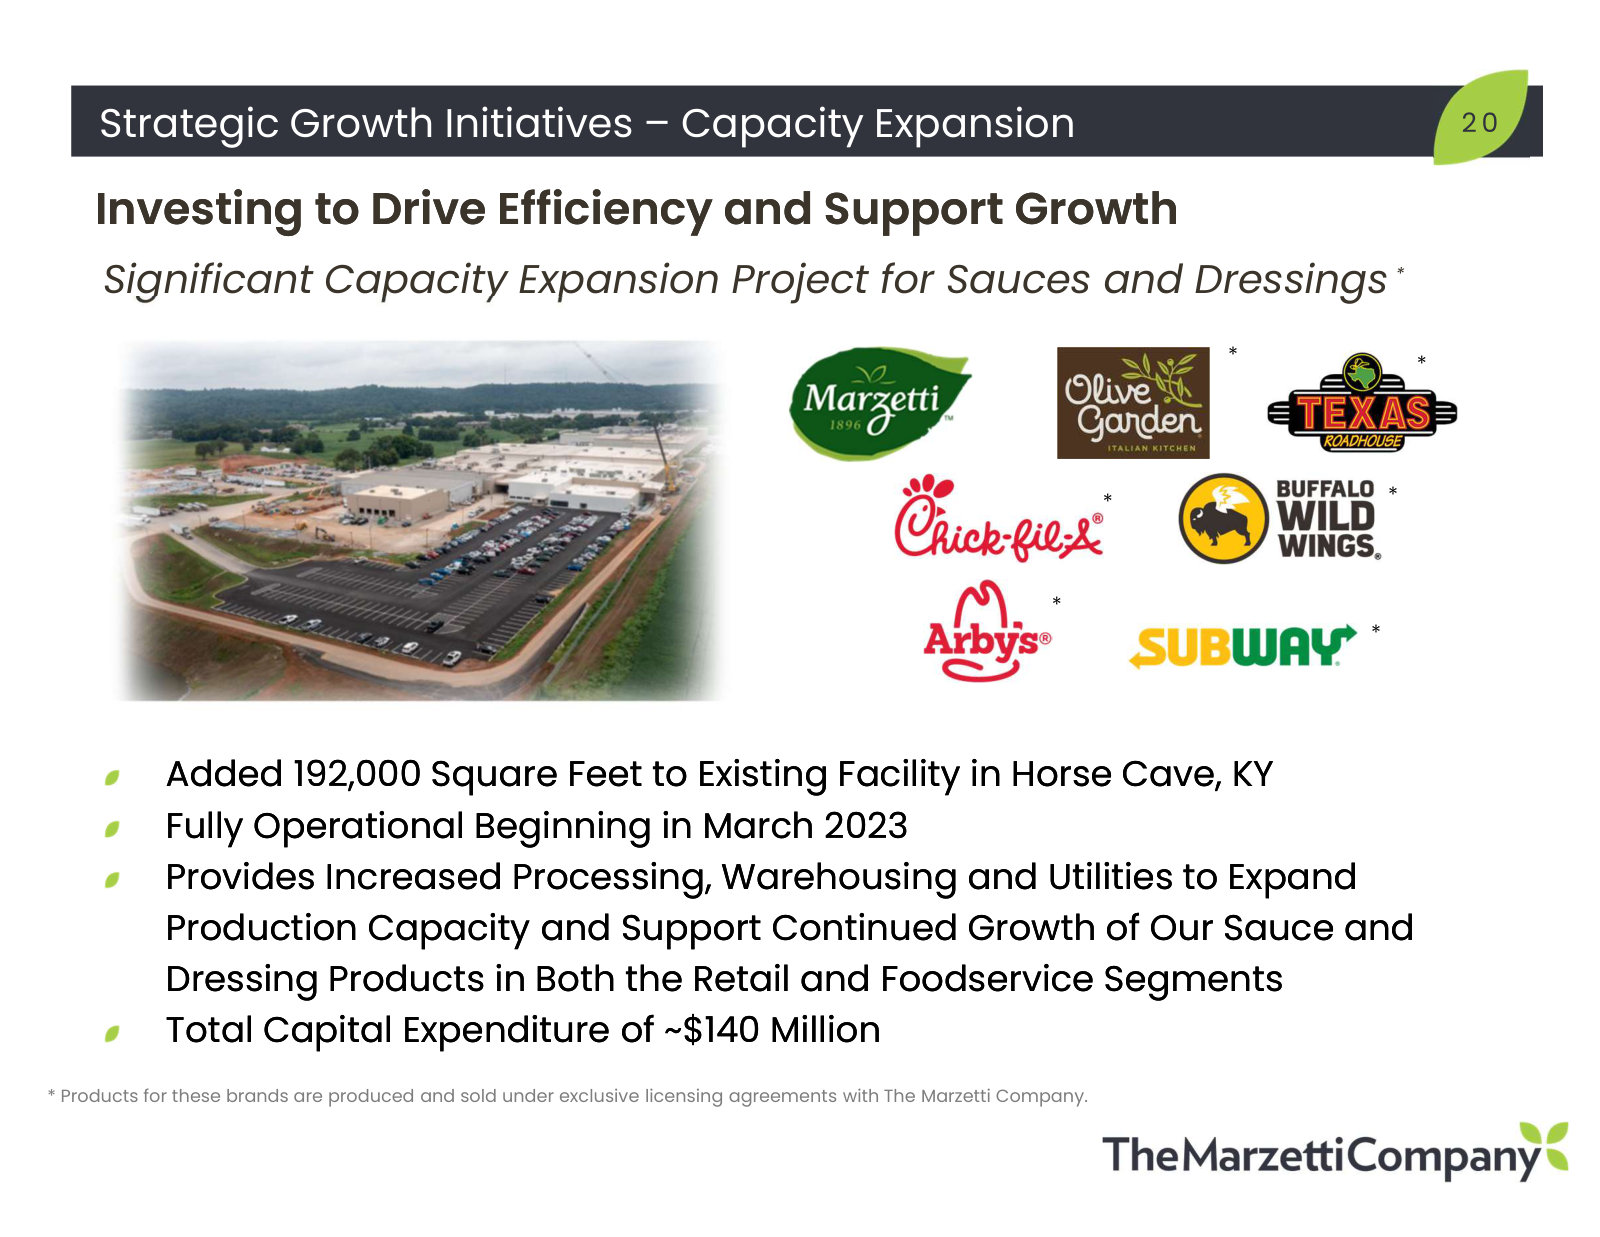
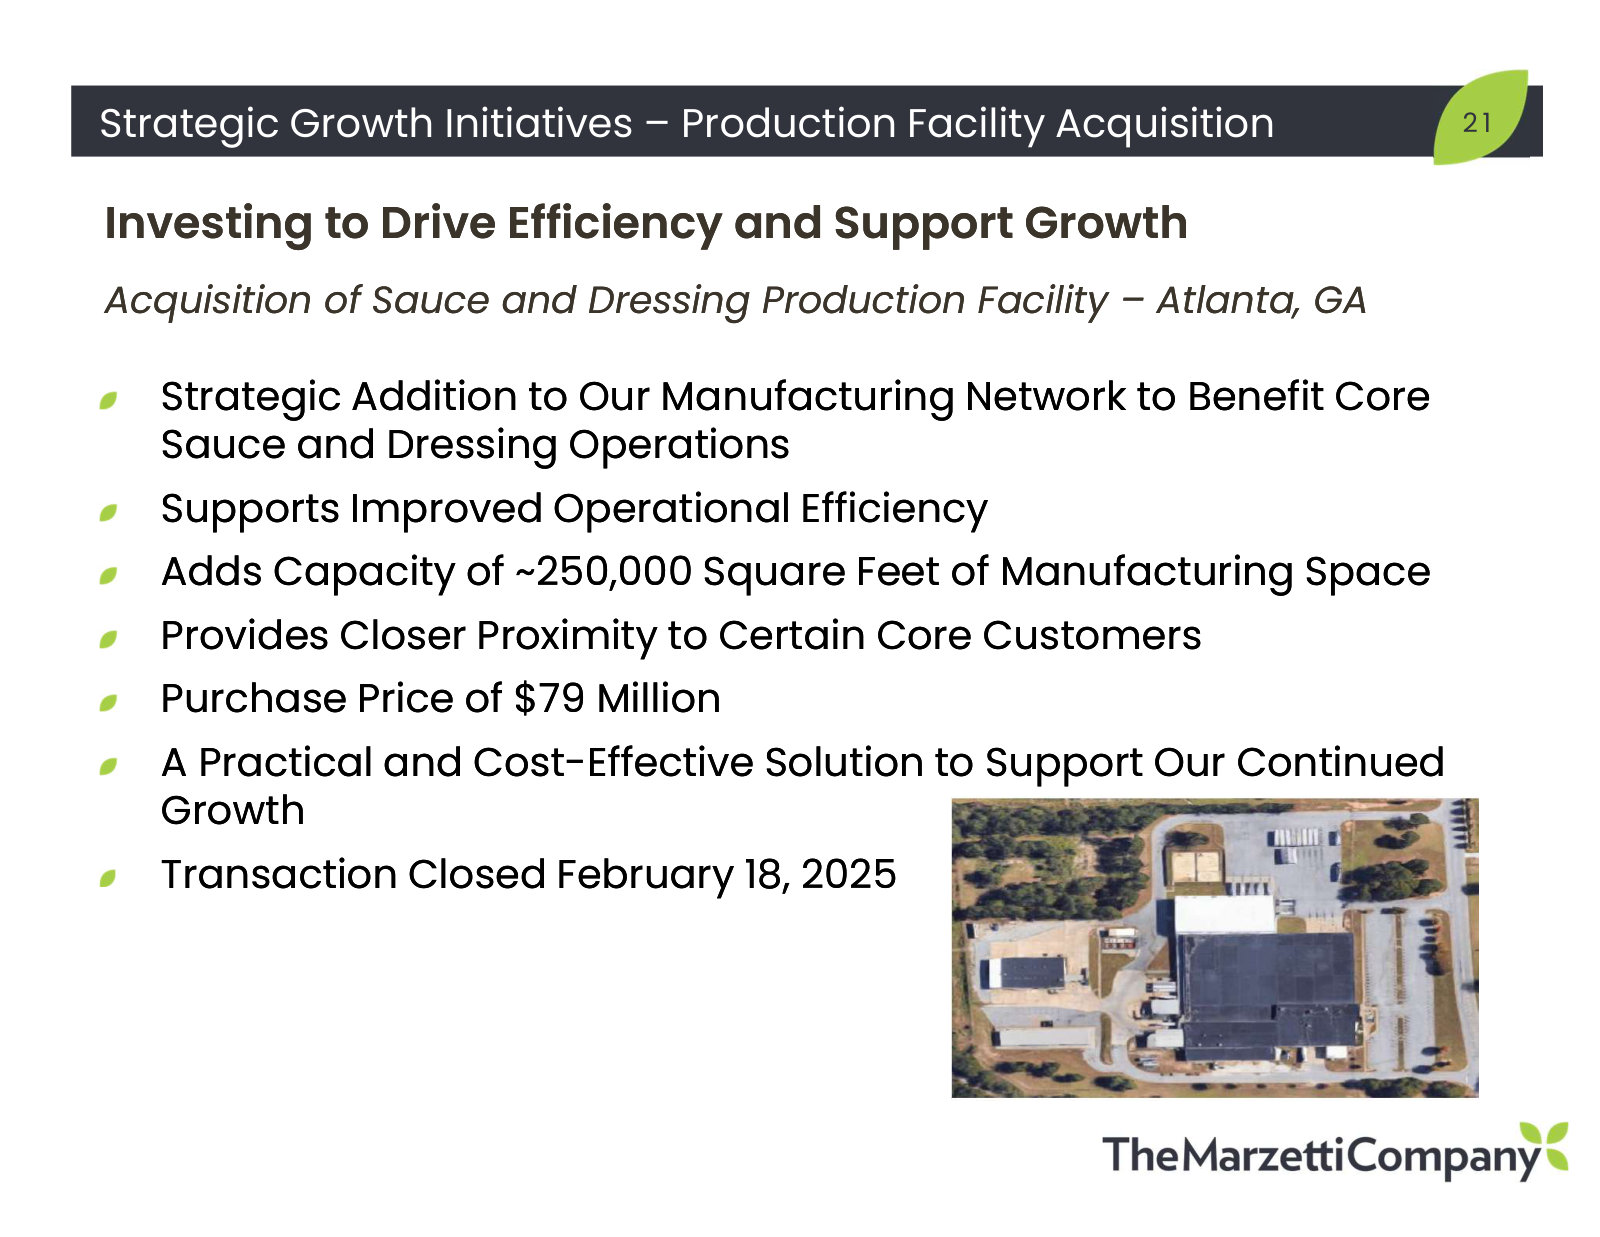
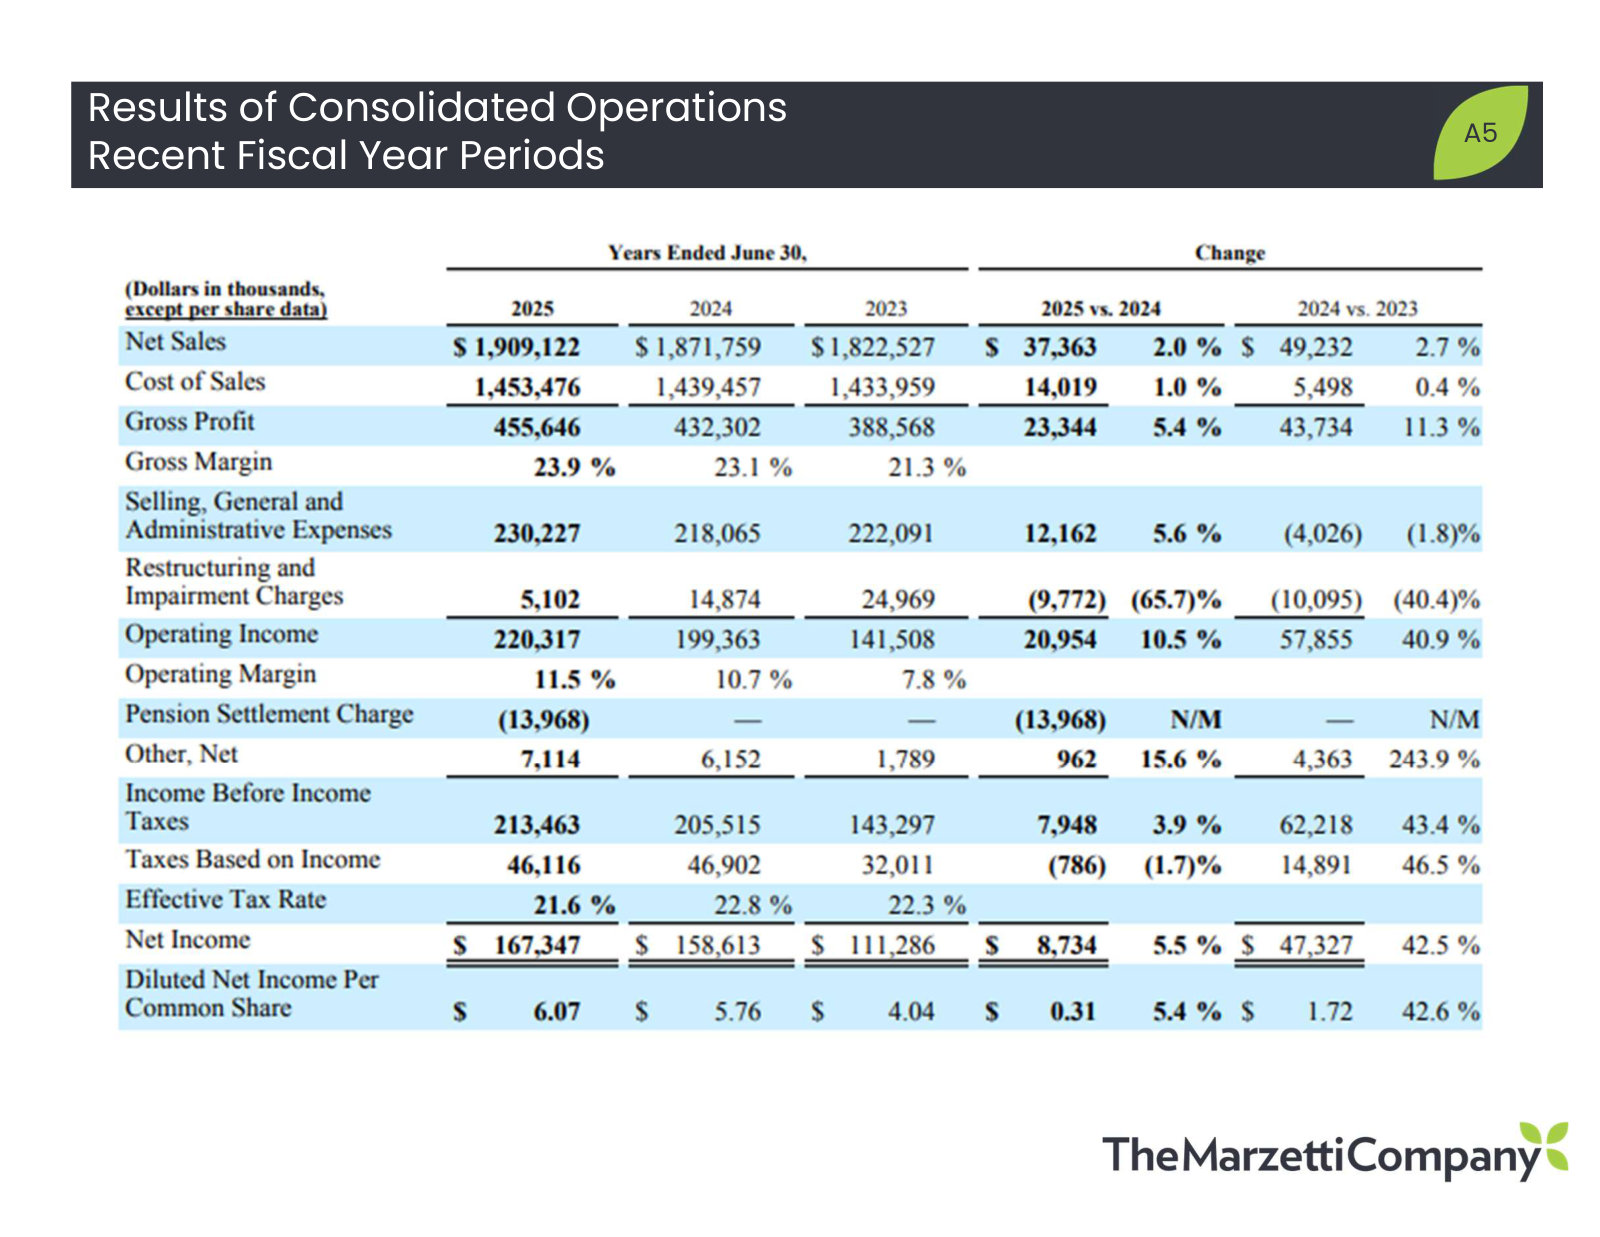
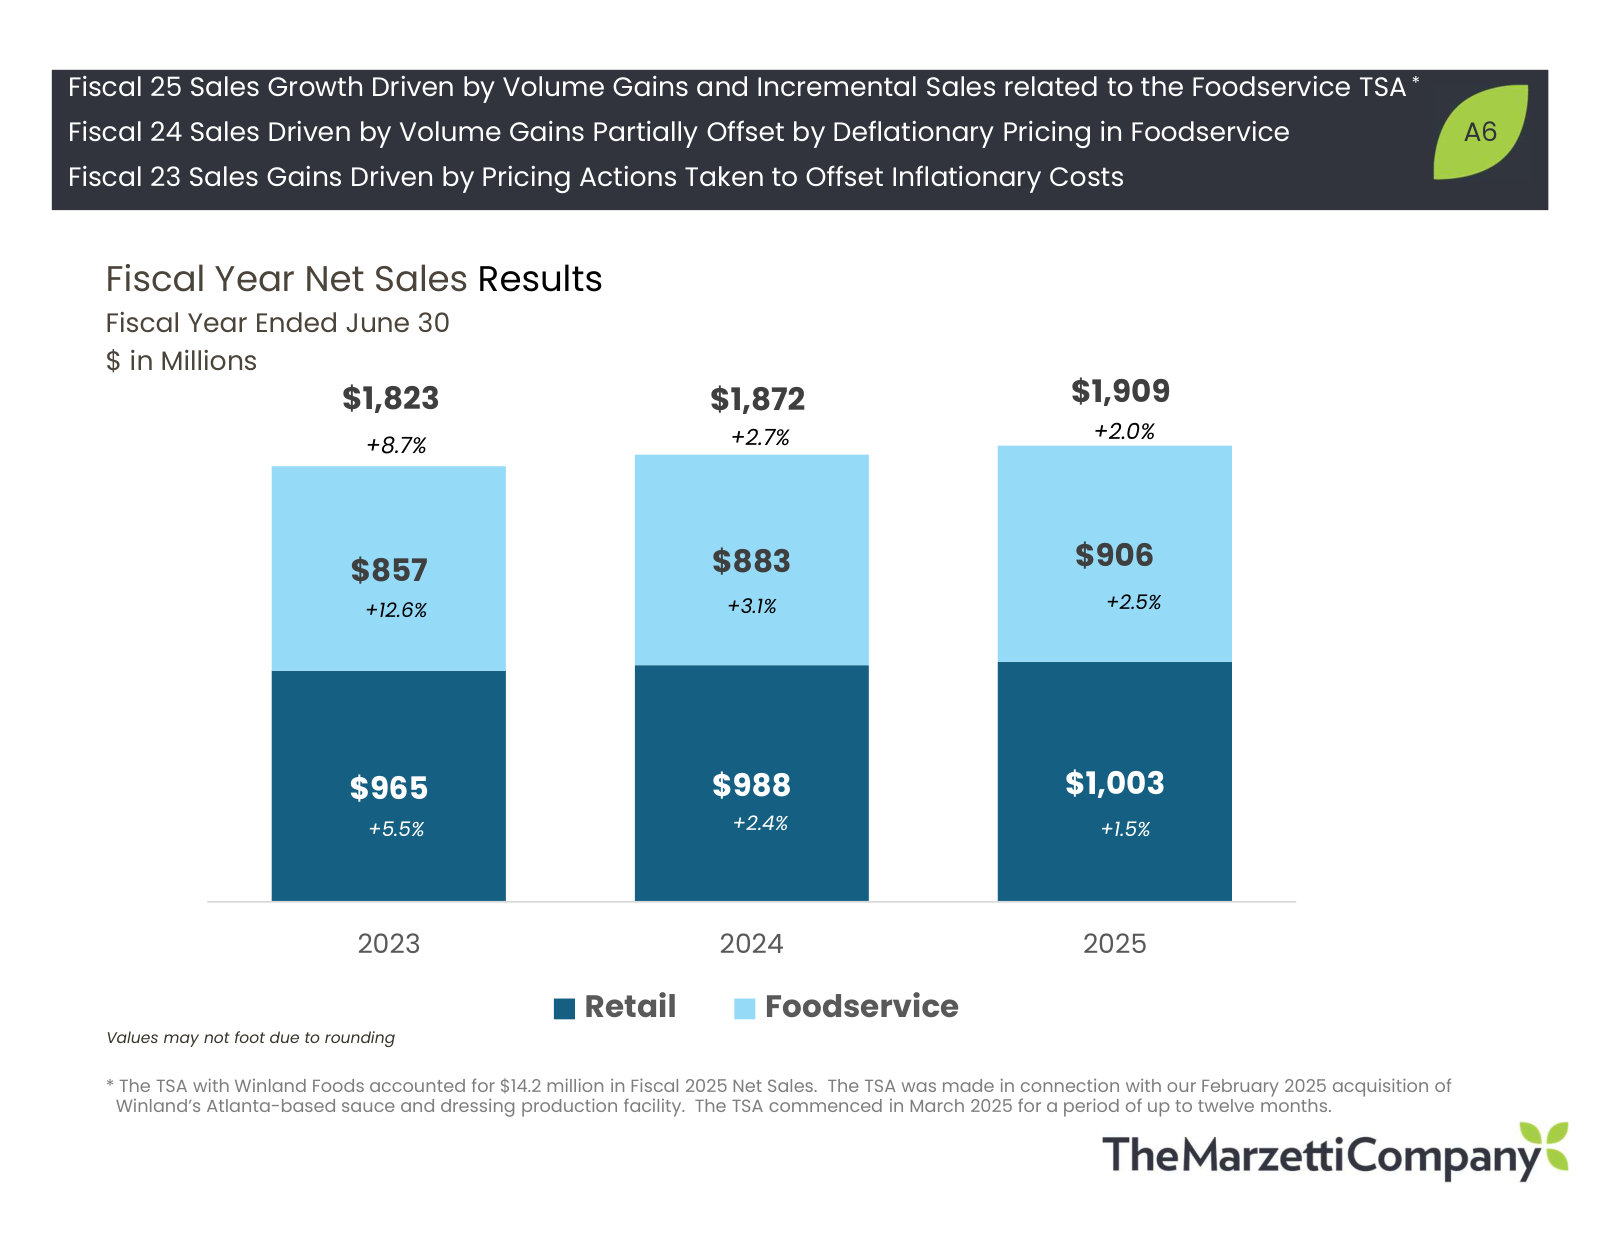
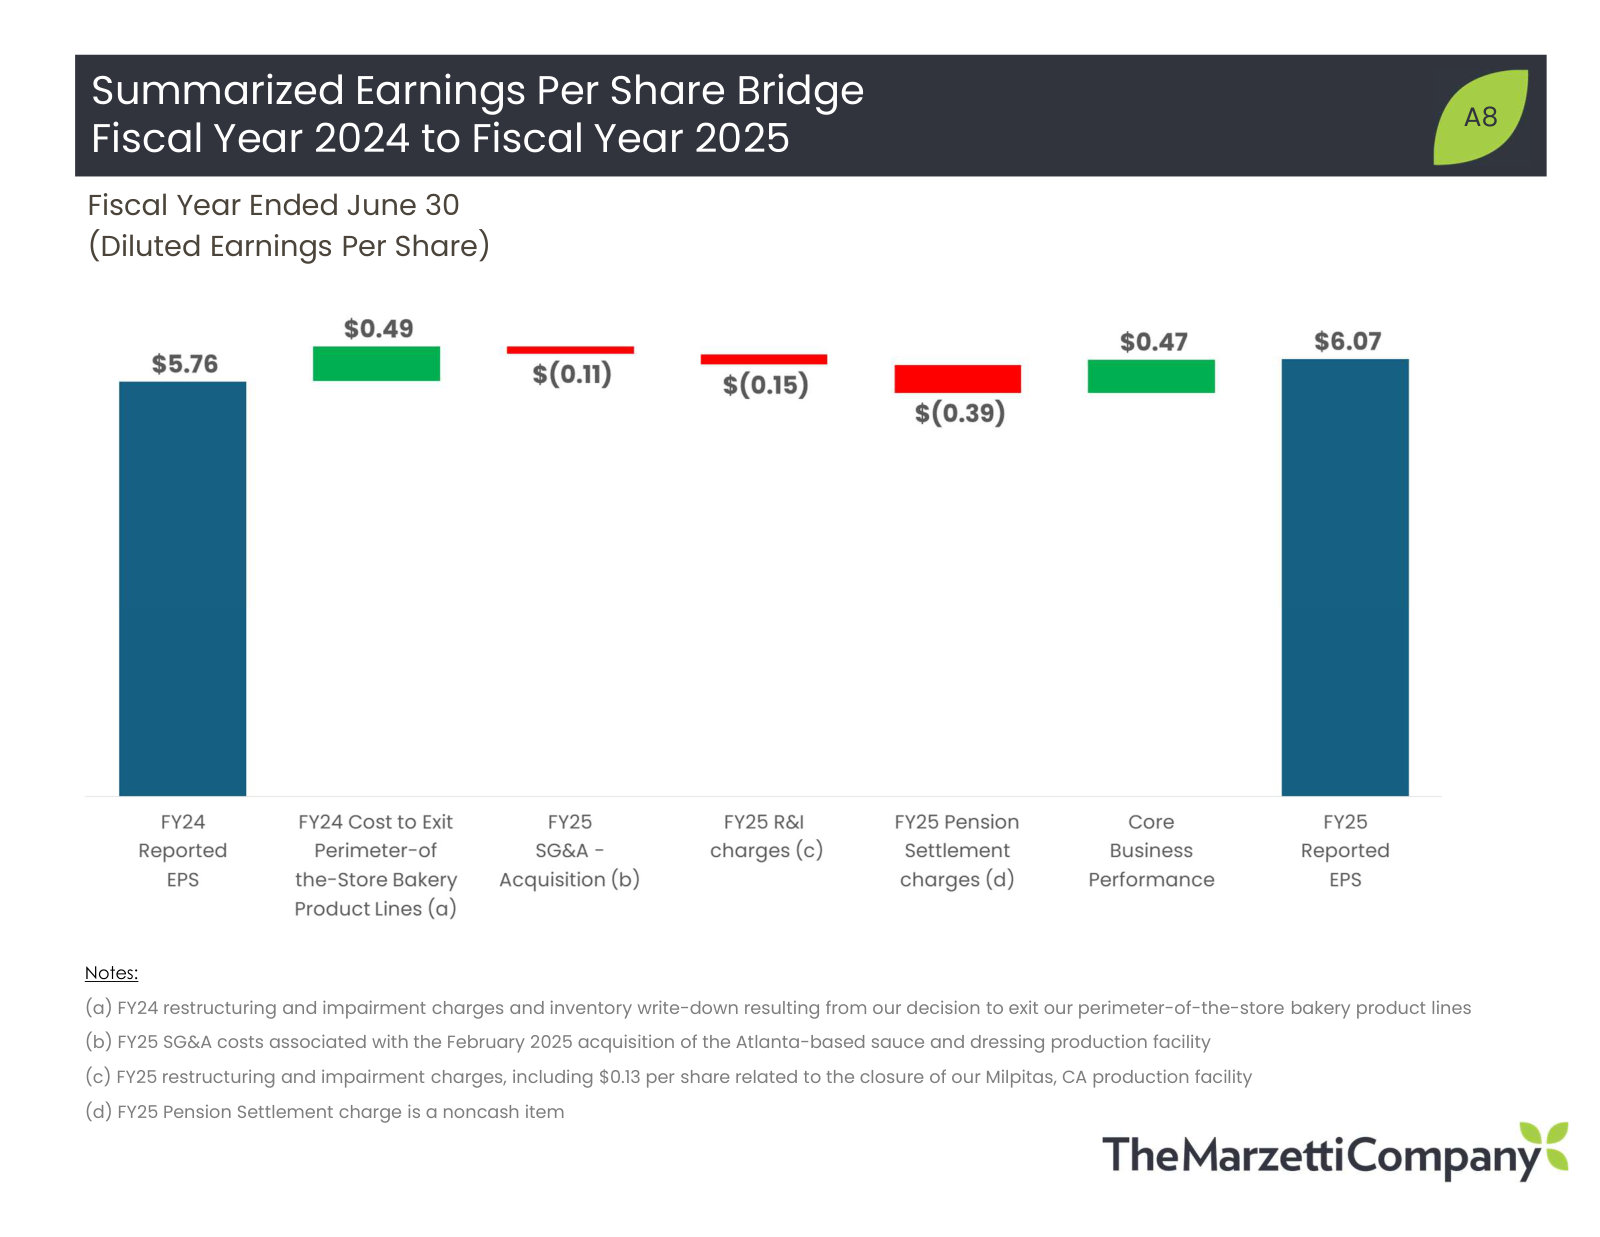
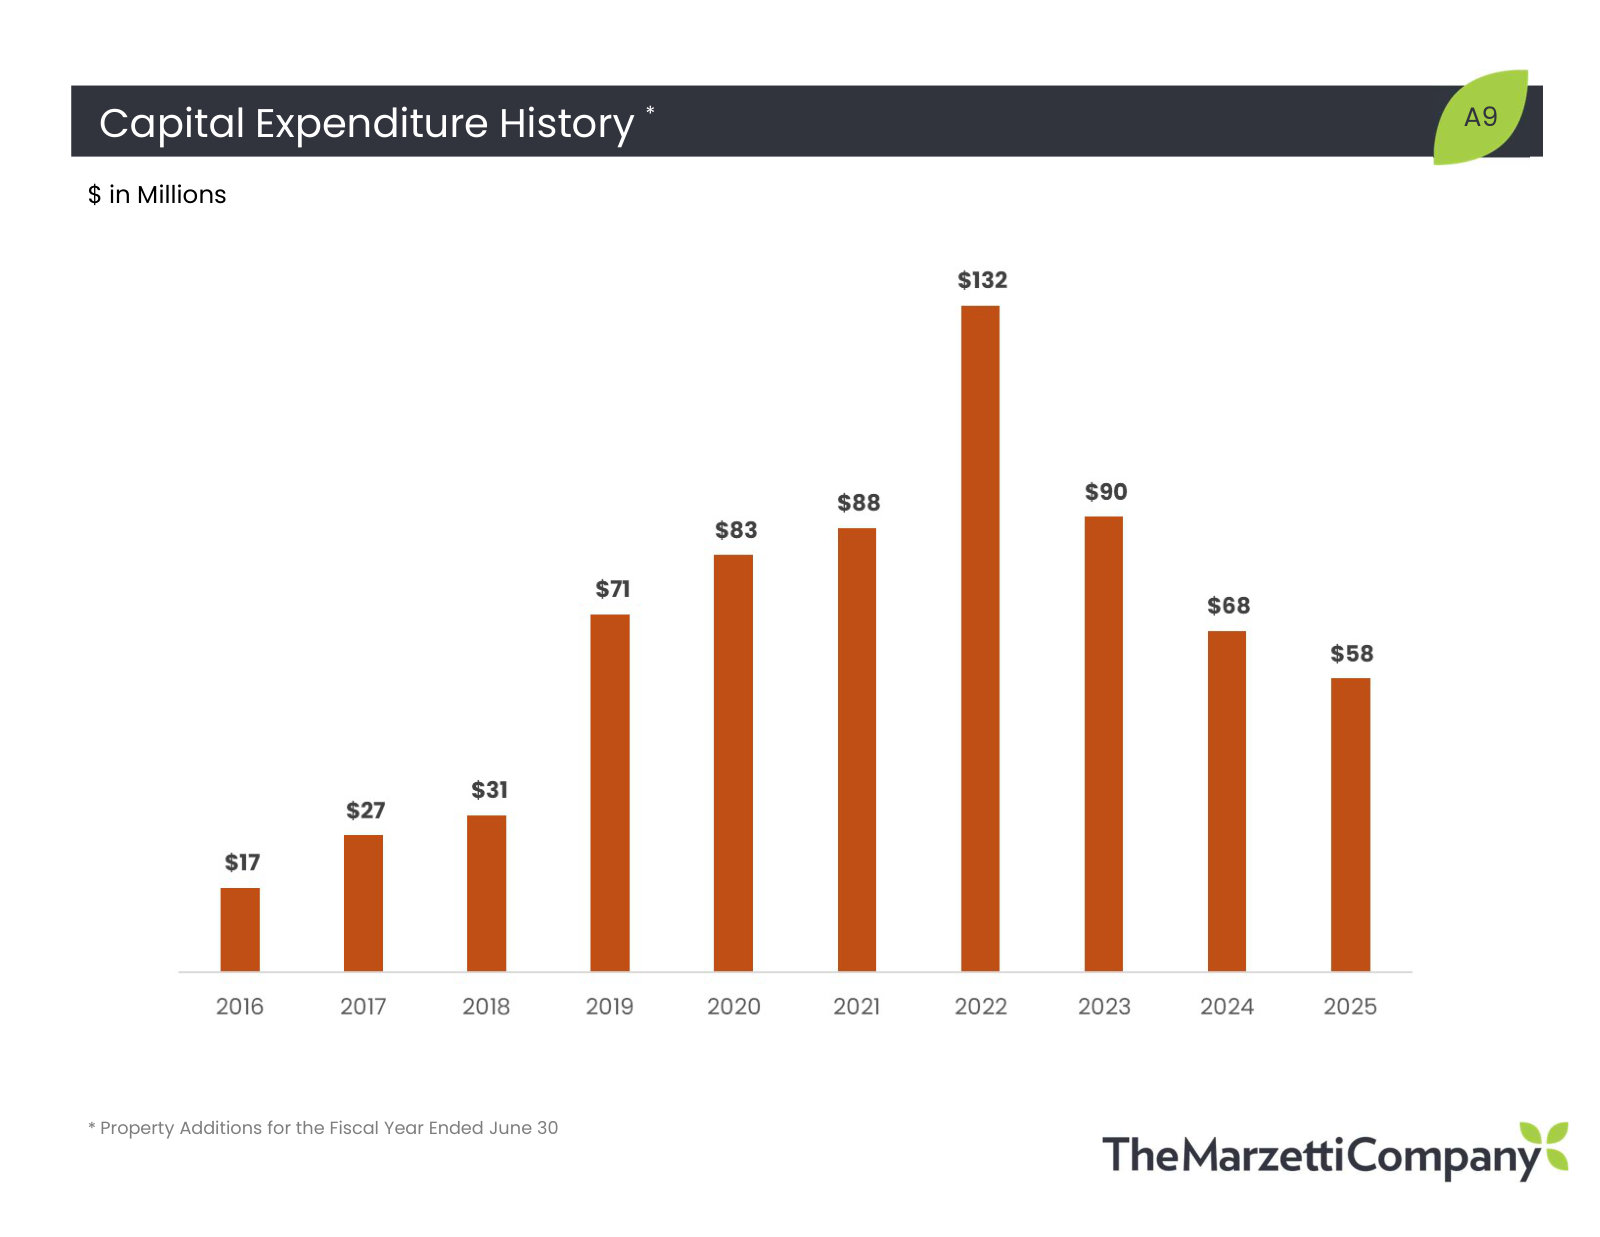
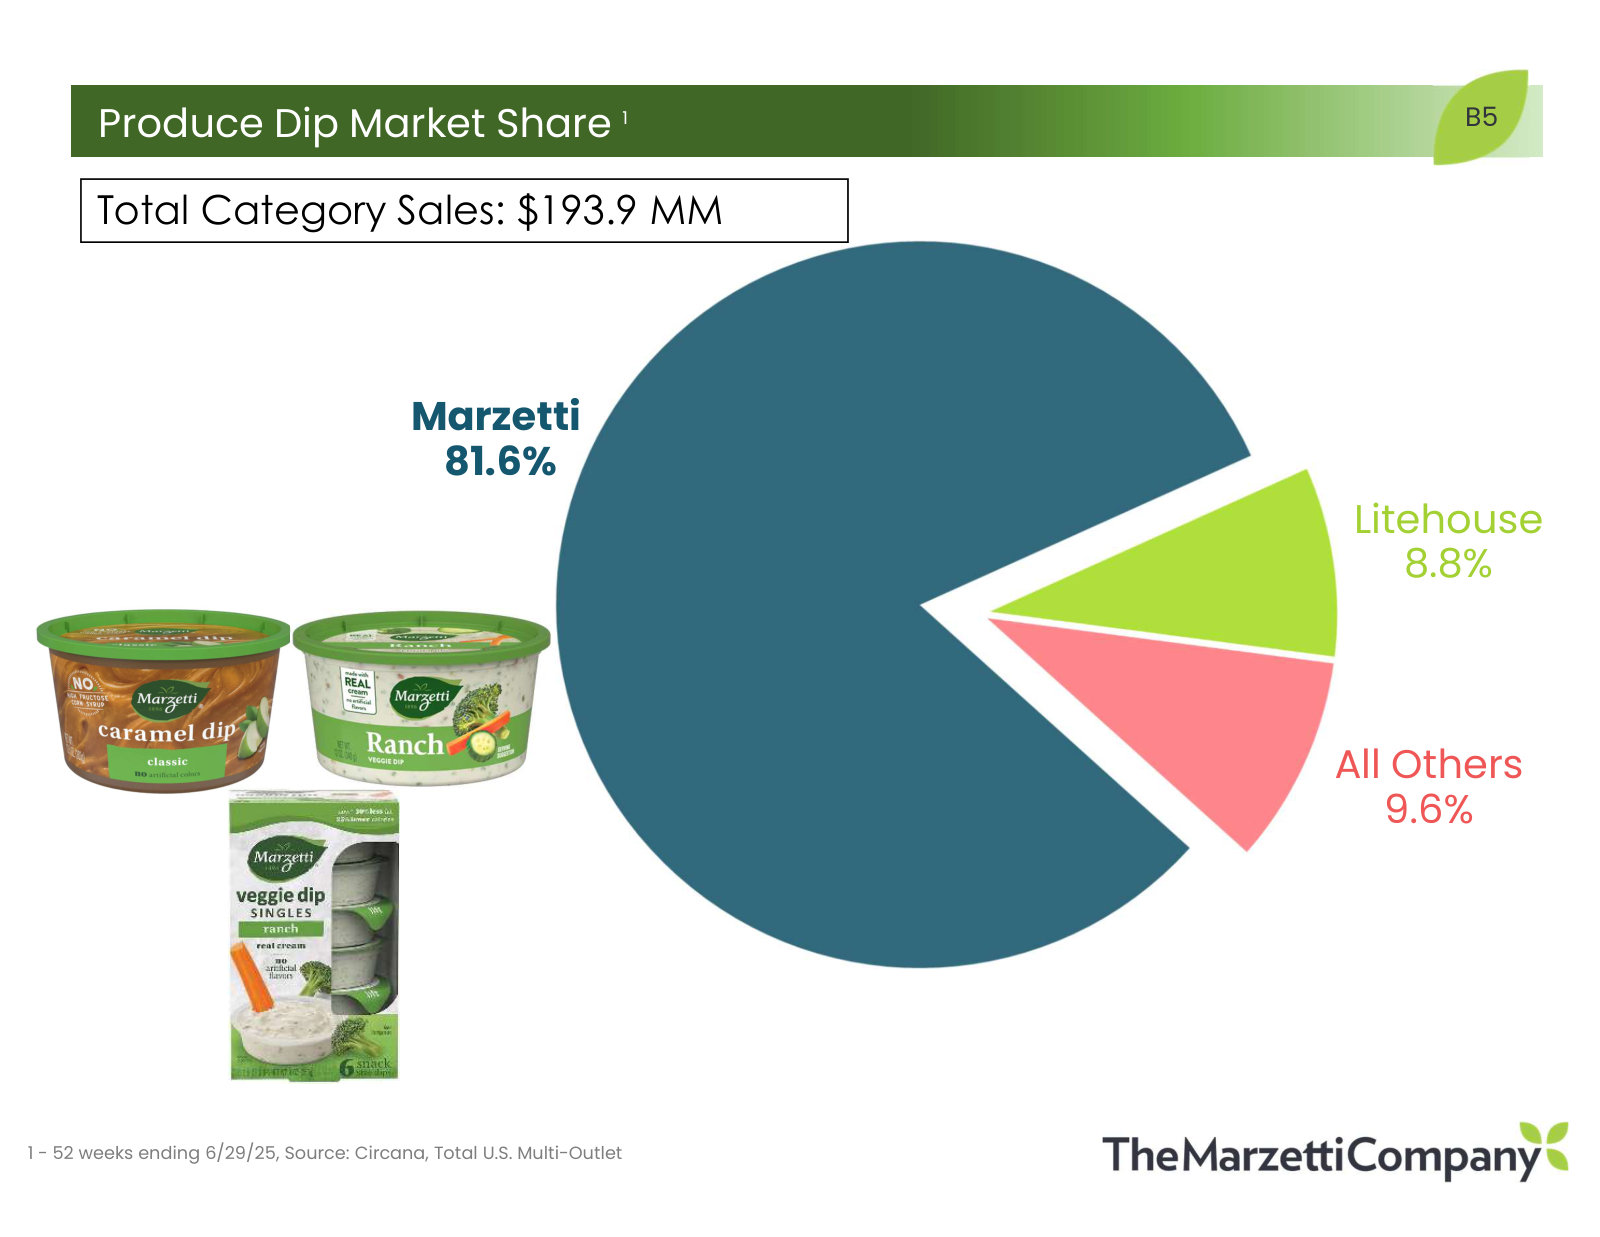
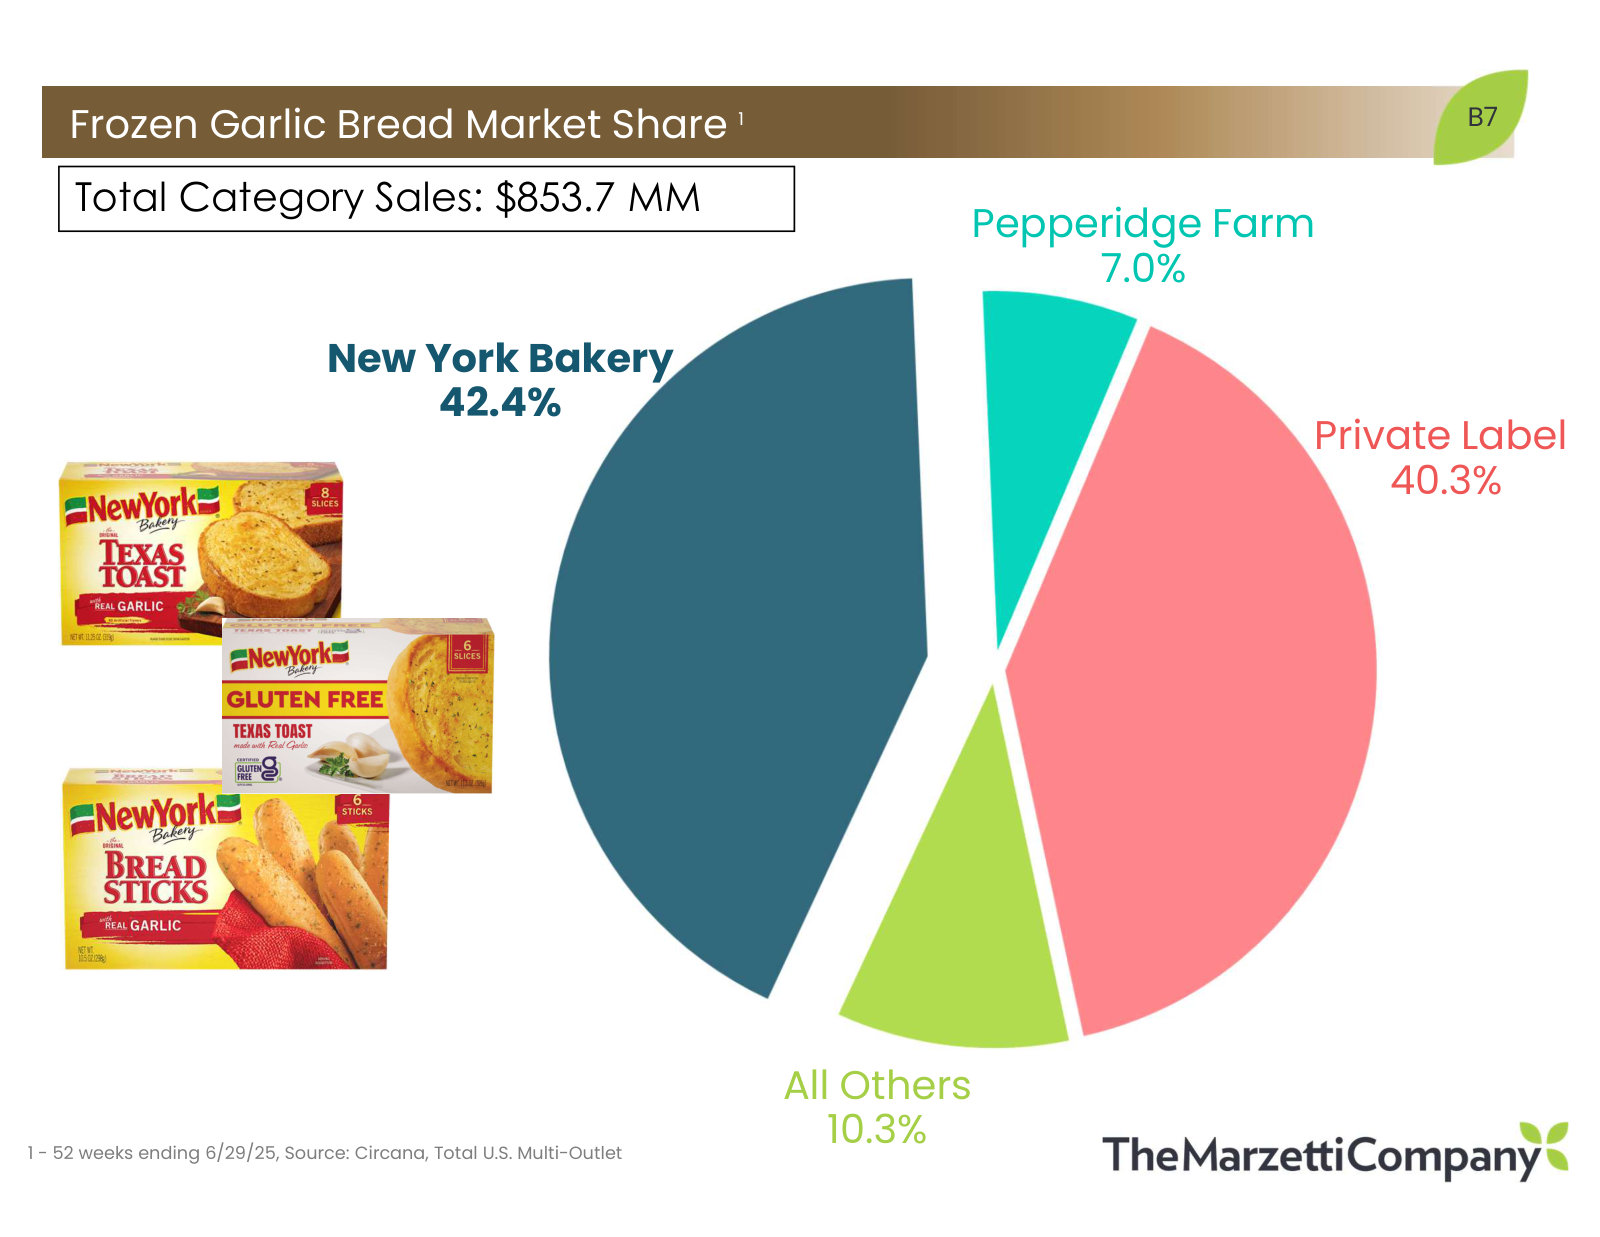
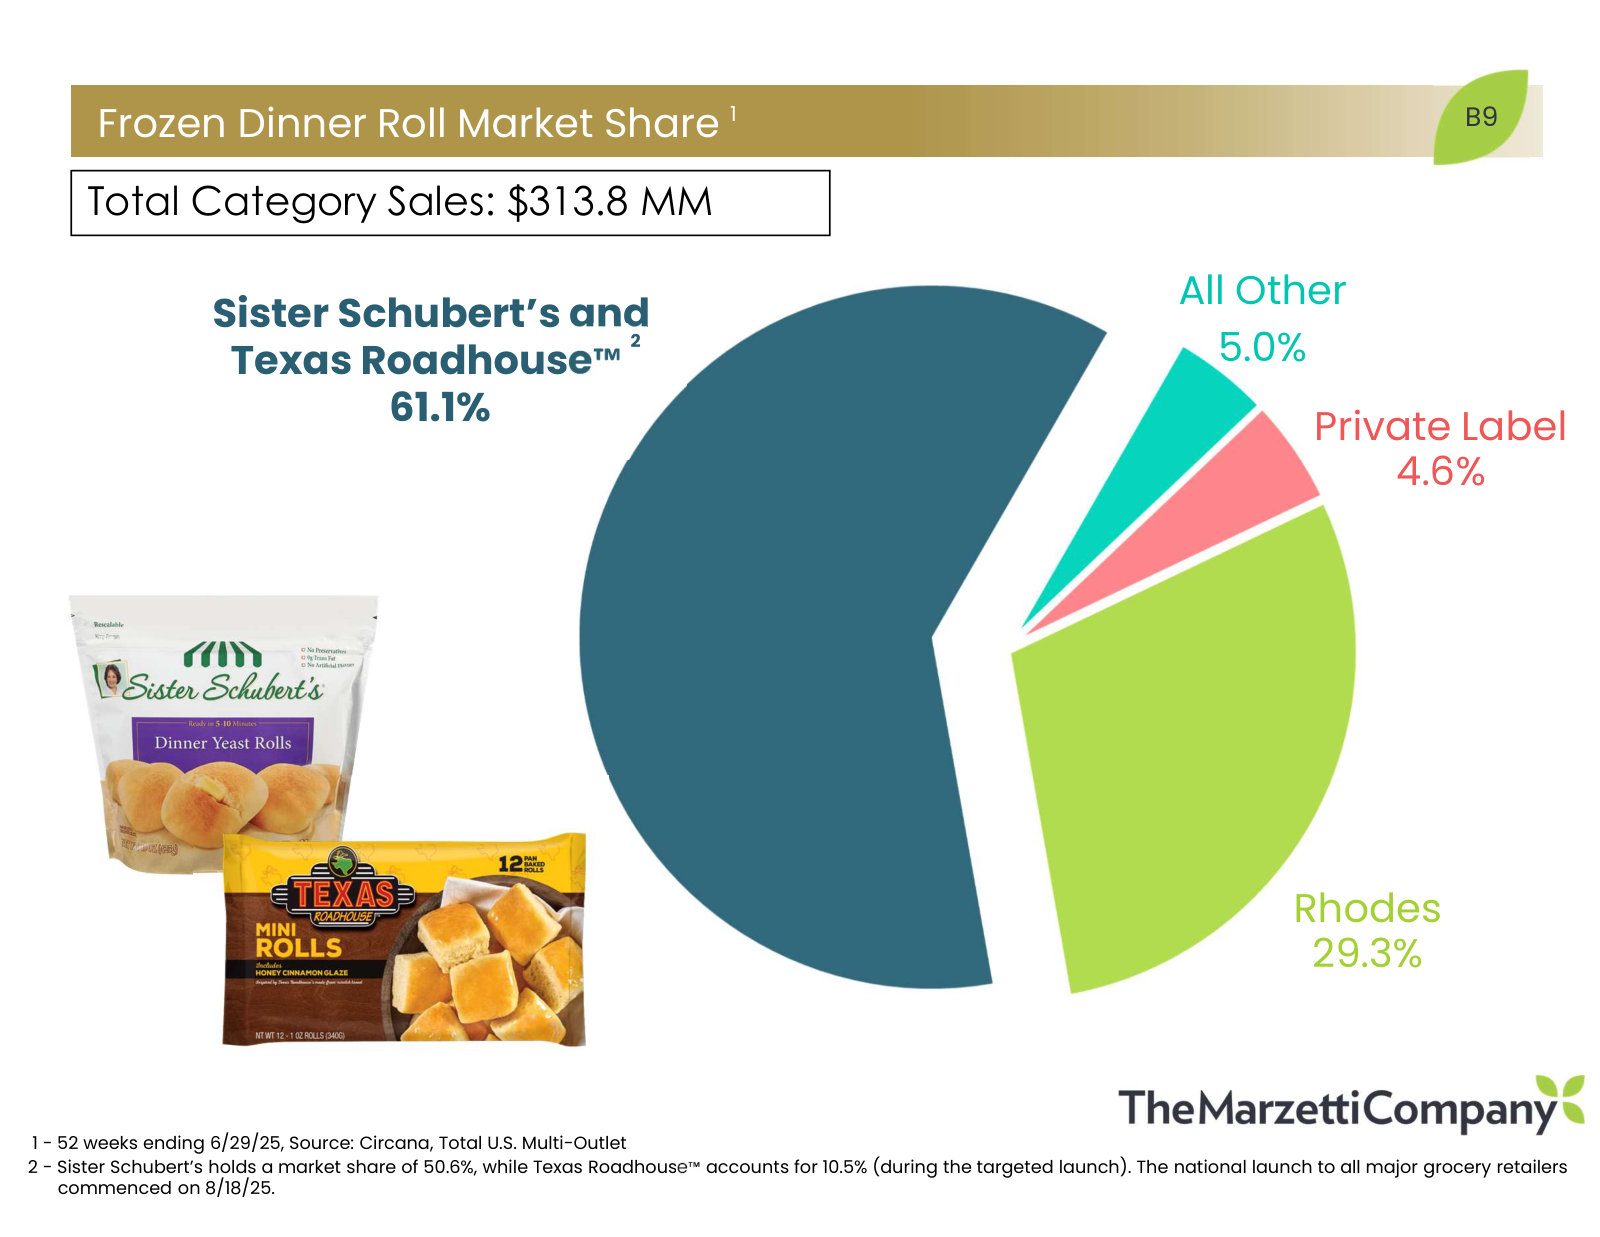
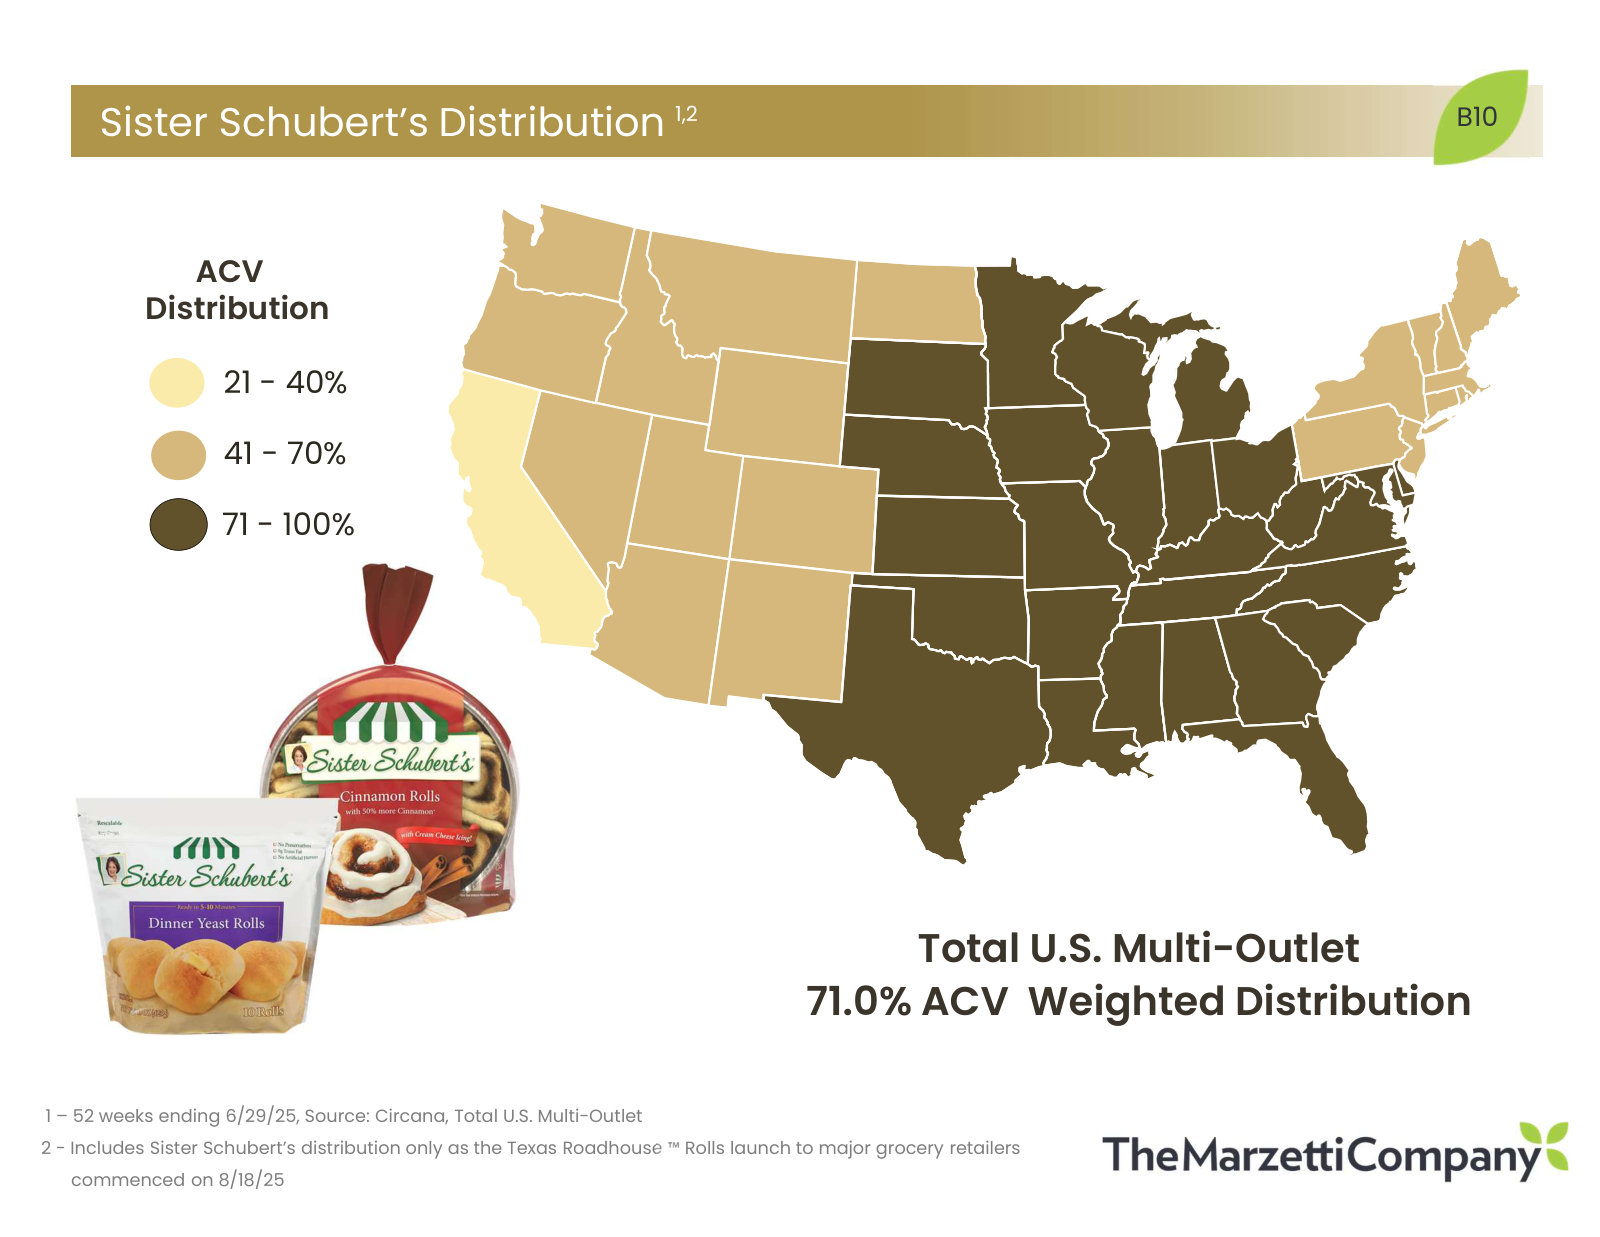
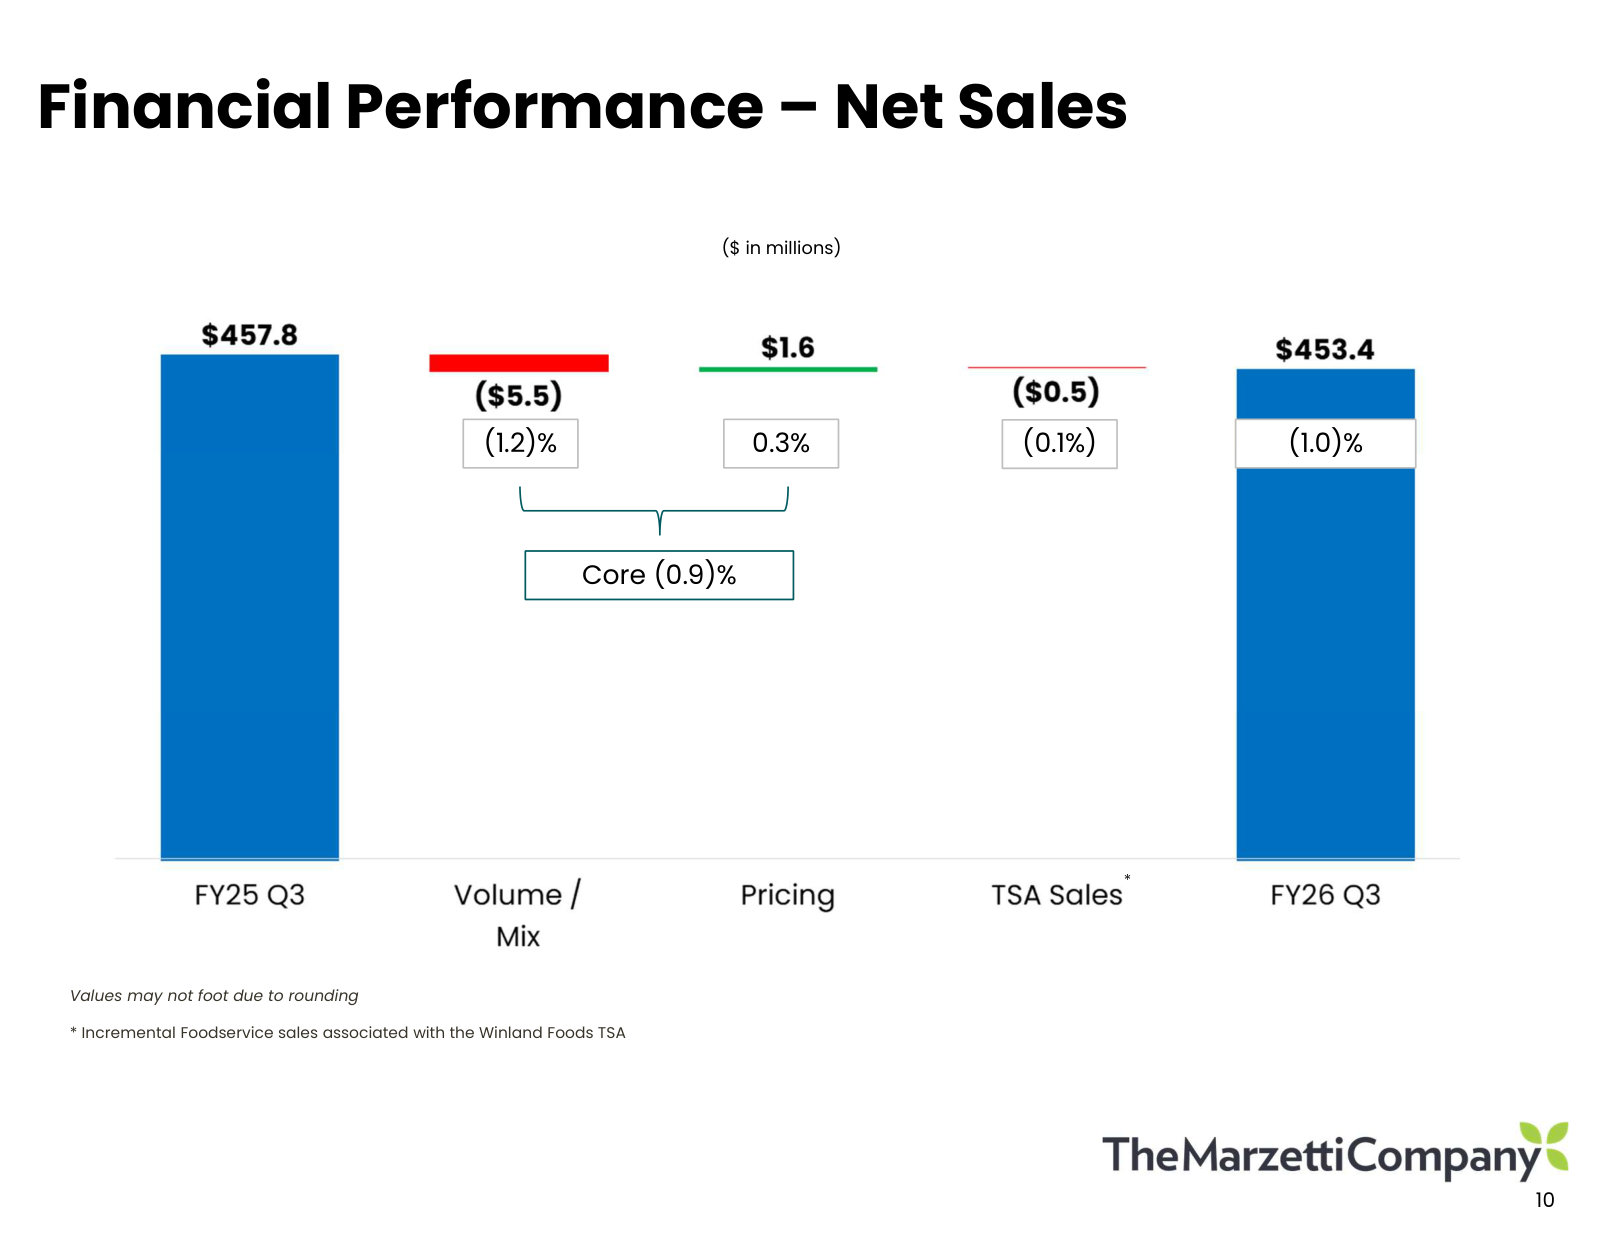
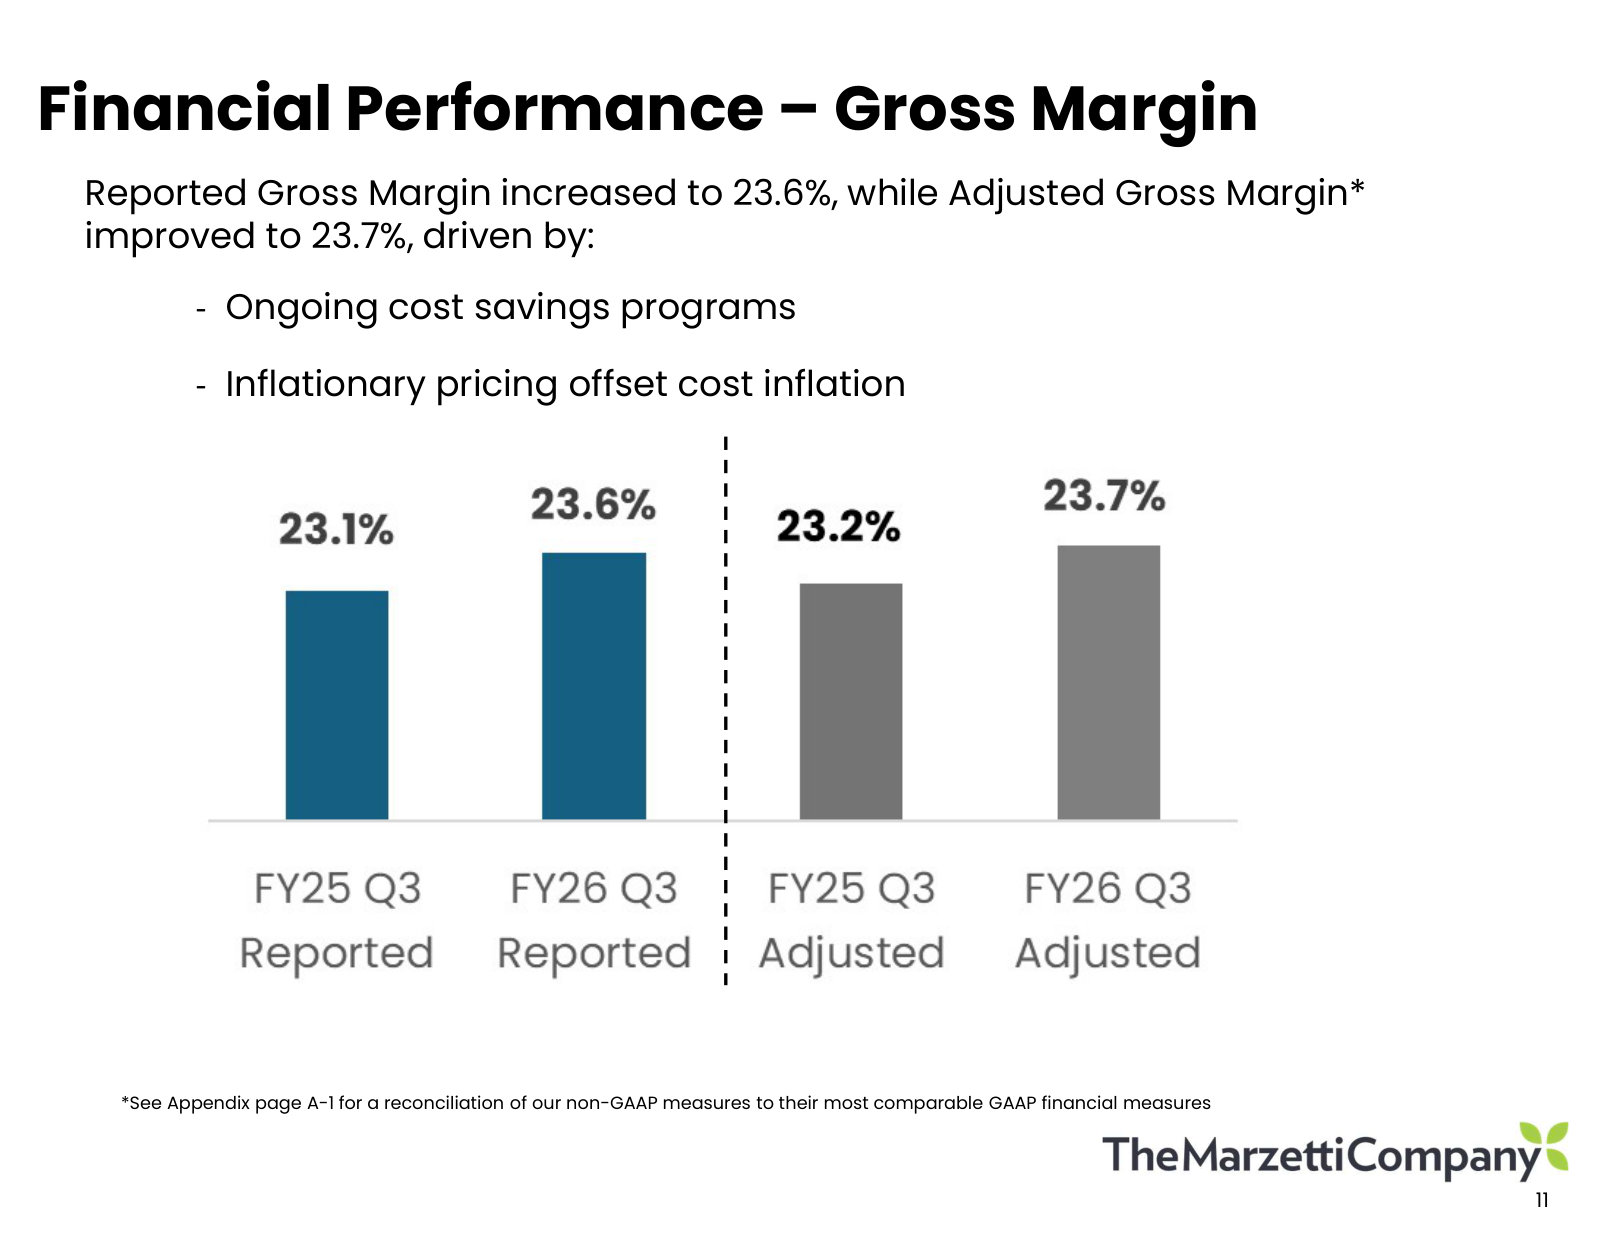
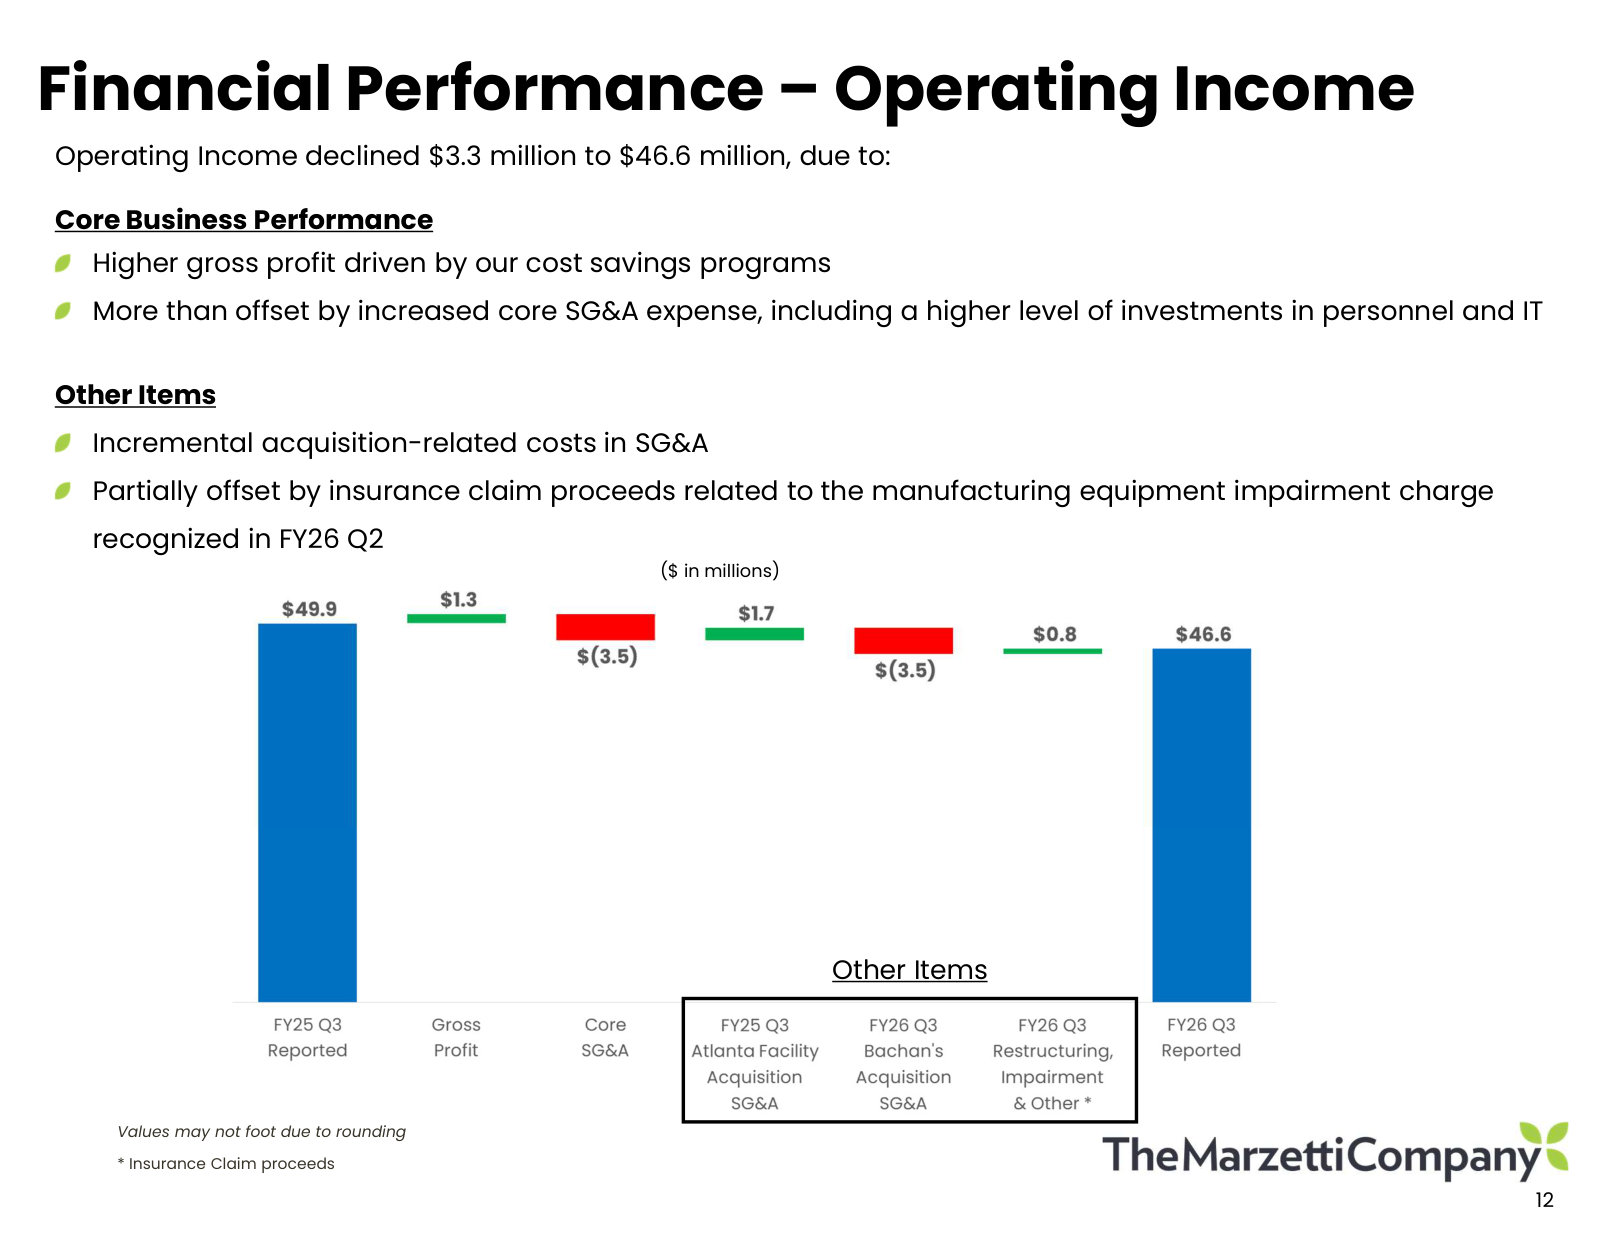
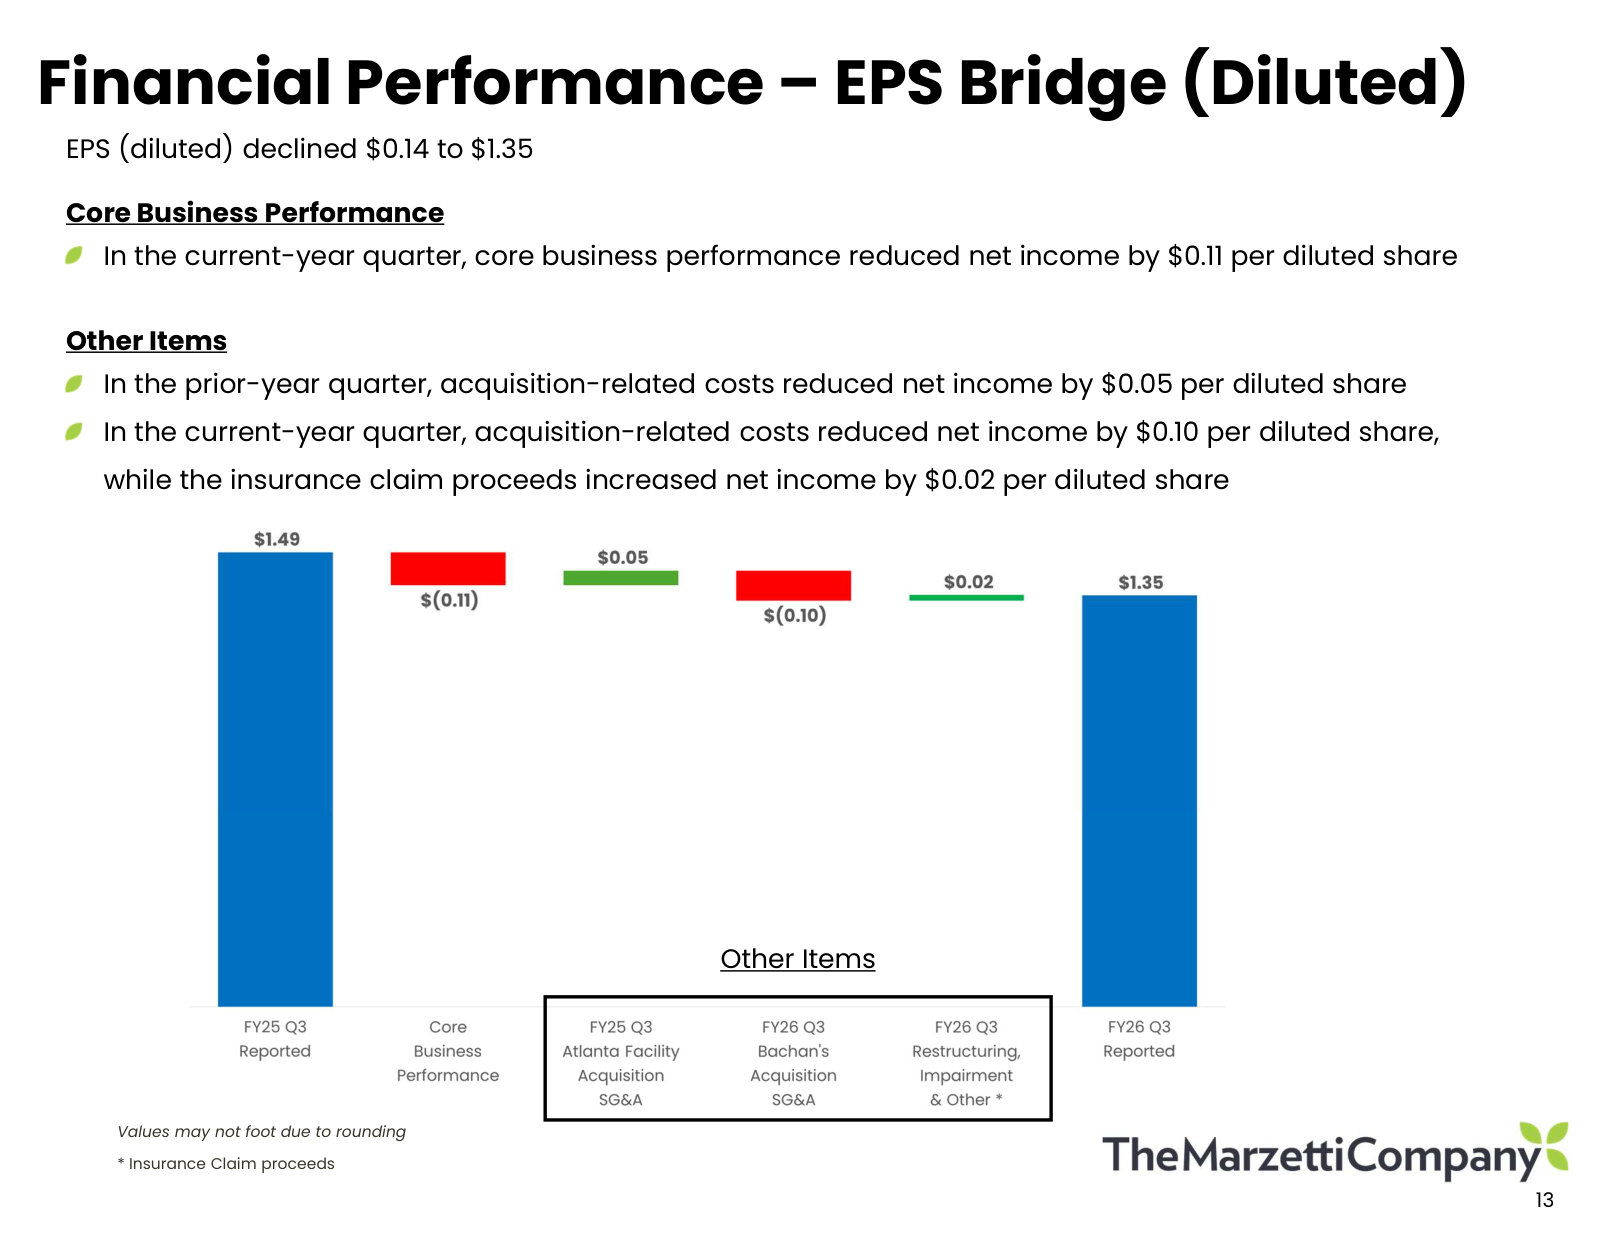
FY26 Q3 Earnings Presentation — FY26 Q3
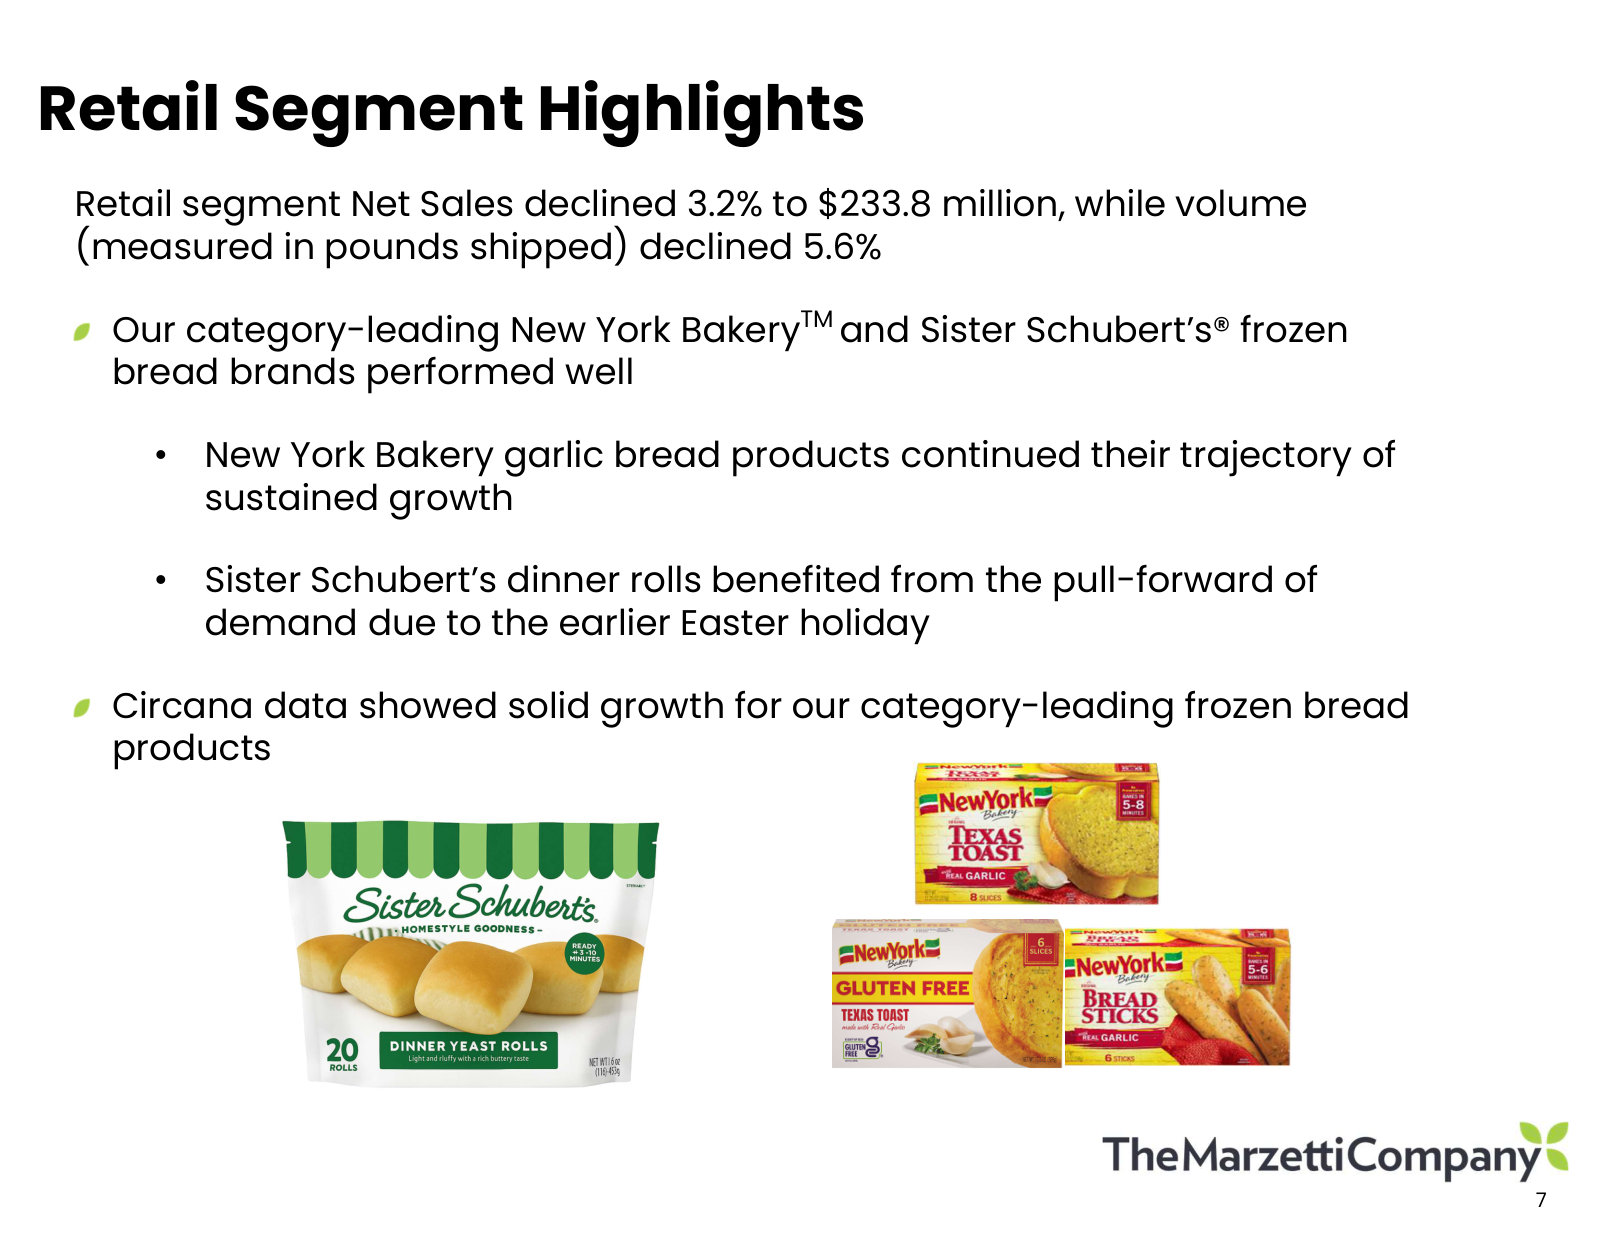
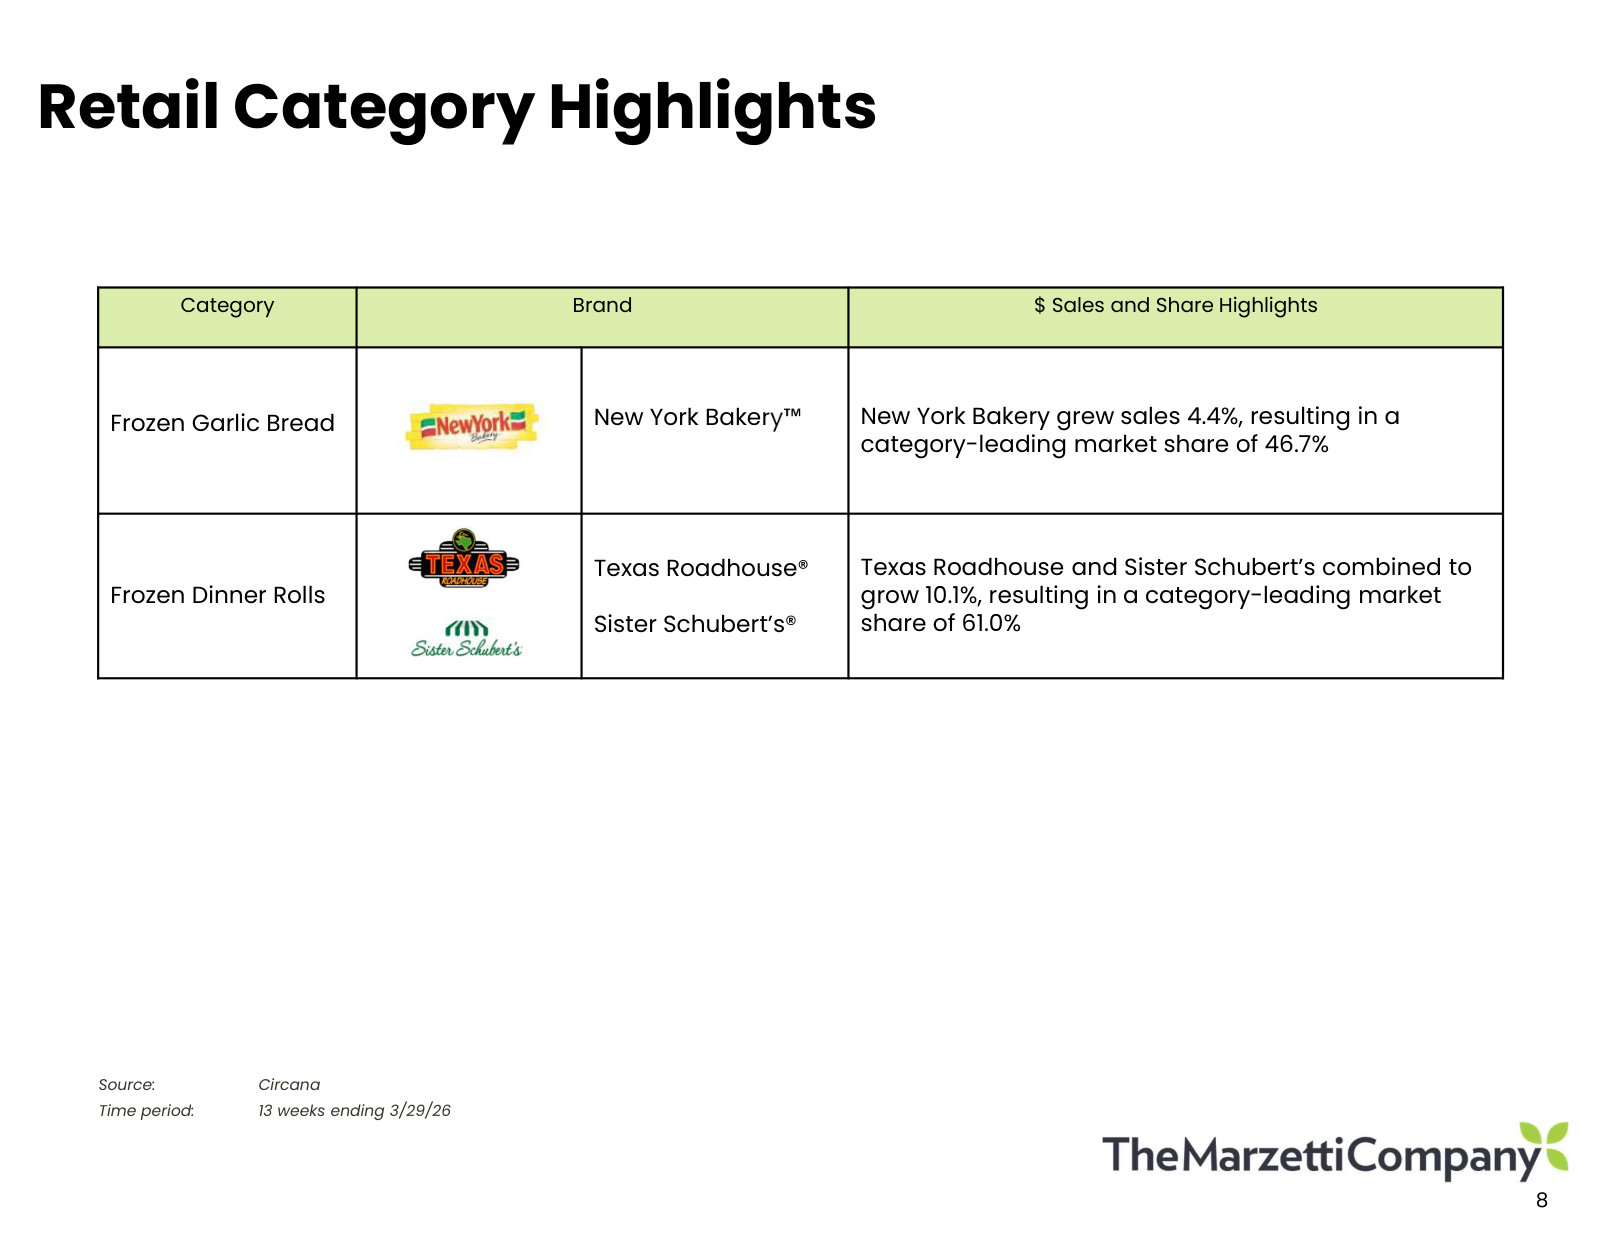
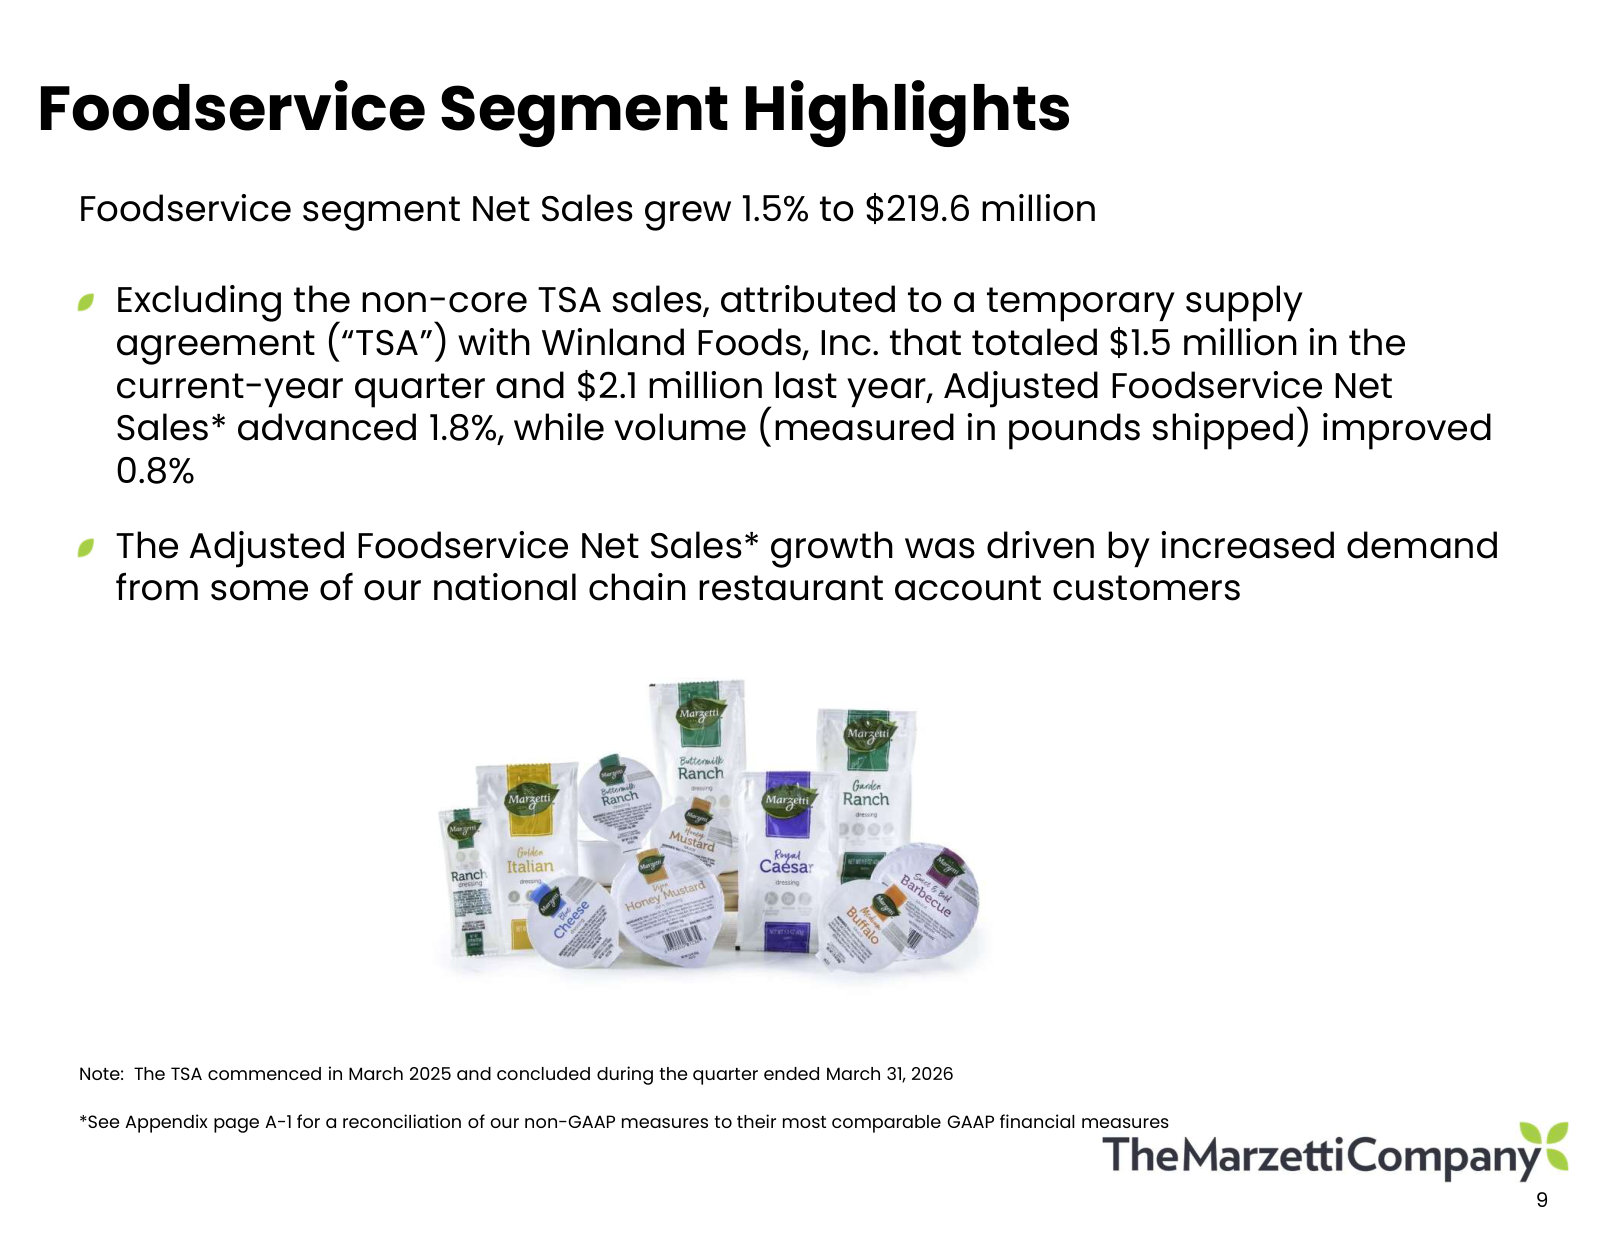
The latest quarterly deck - segment volume and pricing detail, plus the margin and earnings bridges the overview deck only summarizes. · Open the full document →
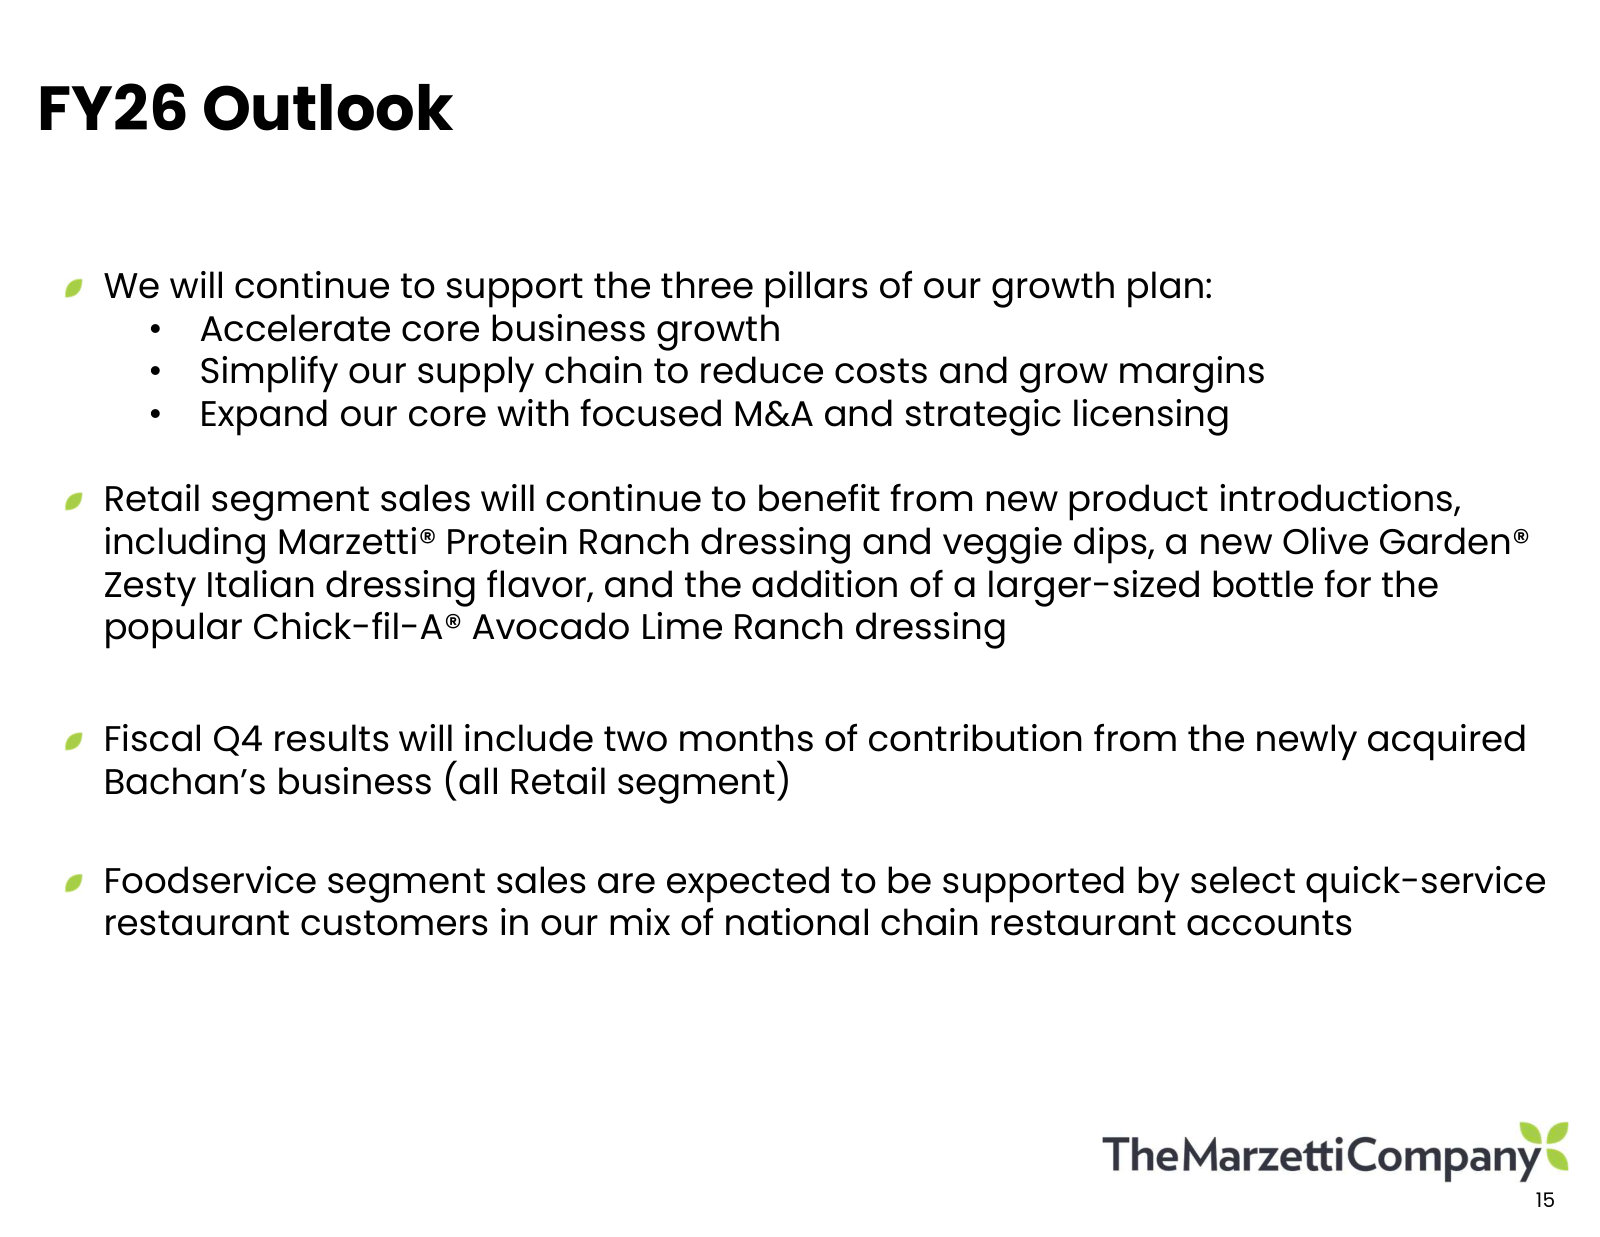
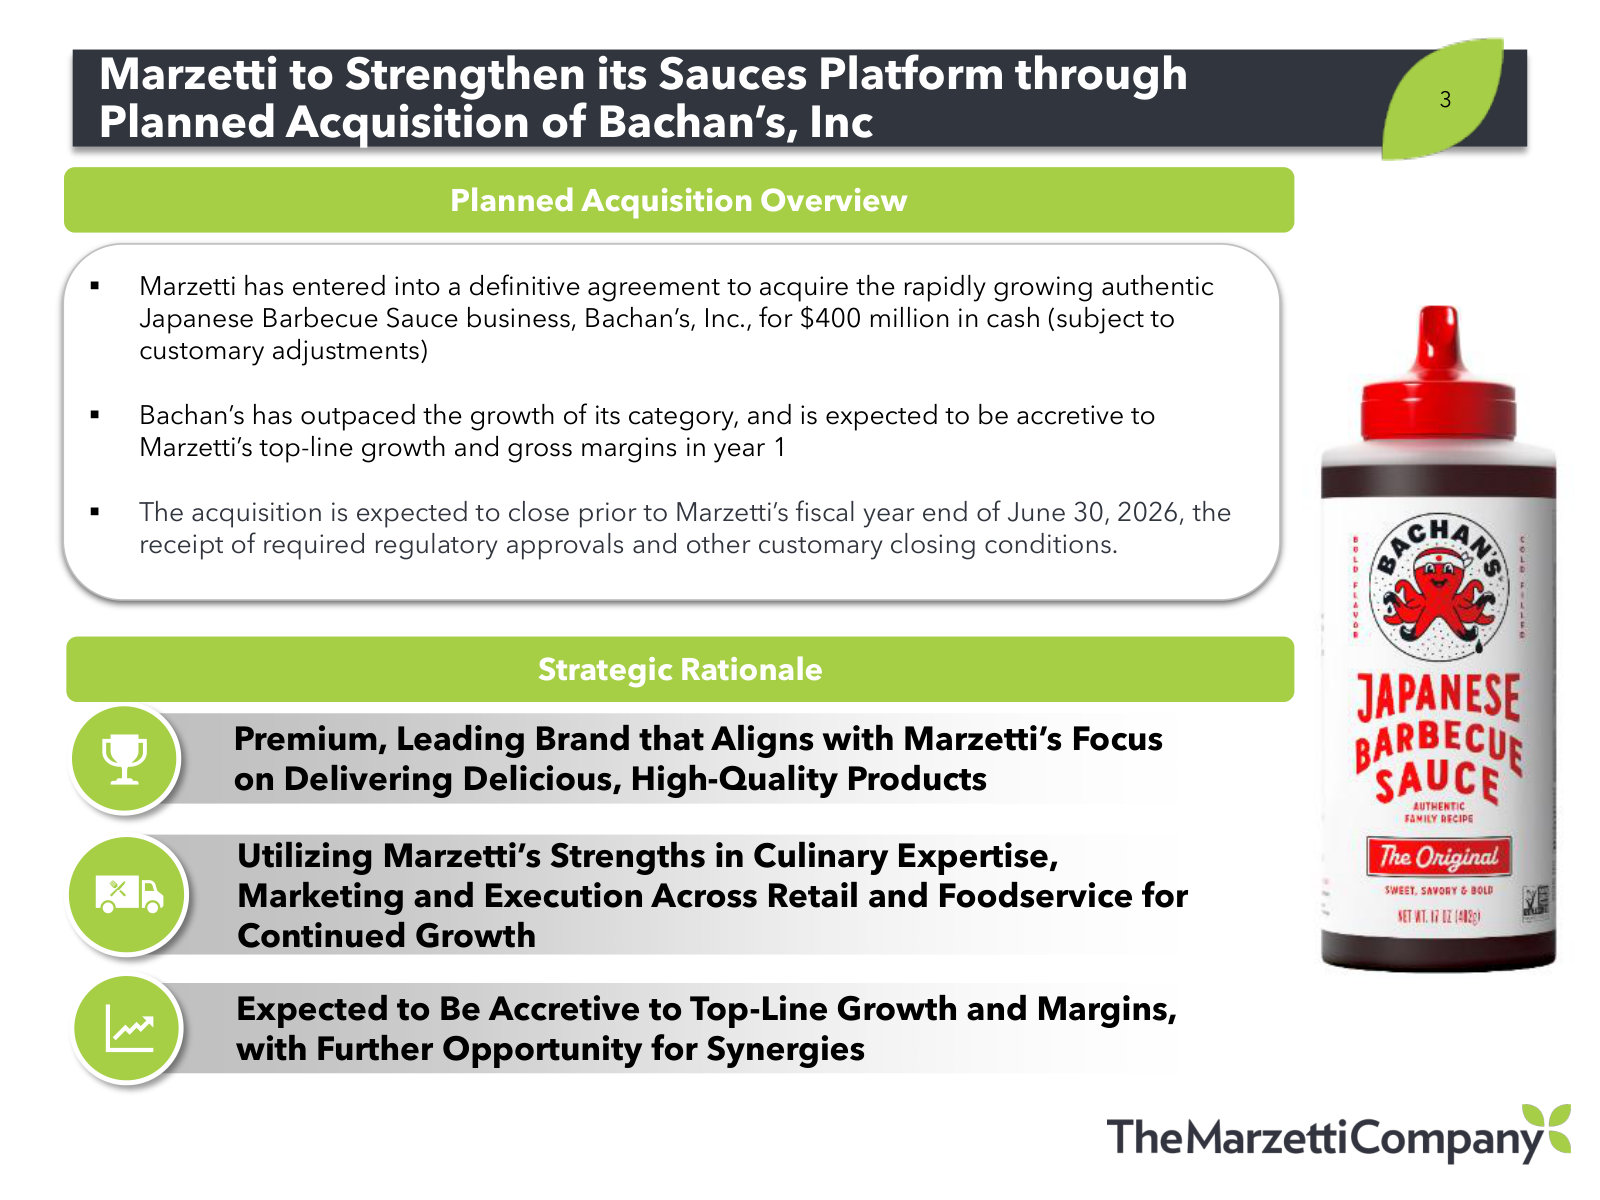
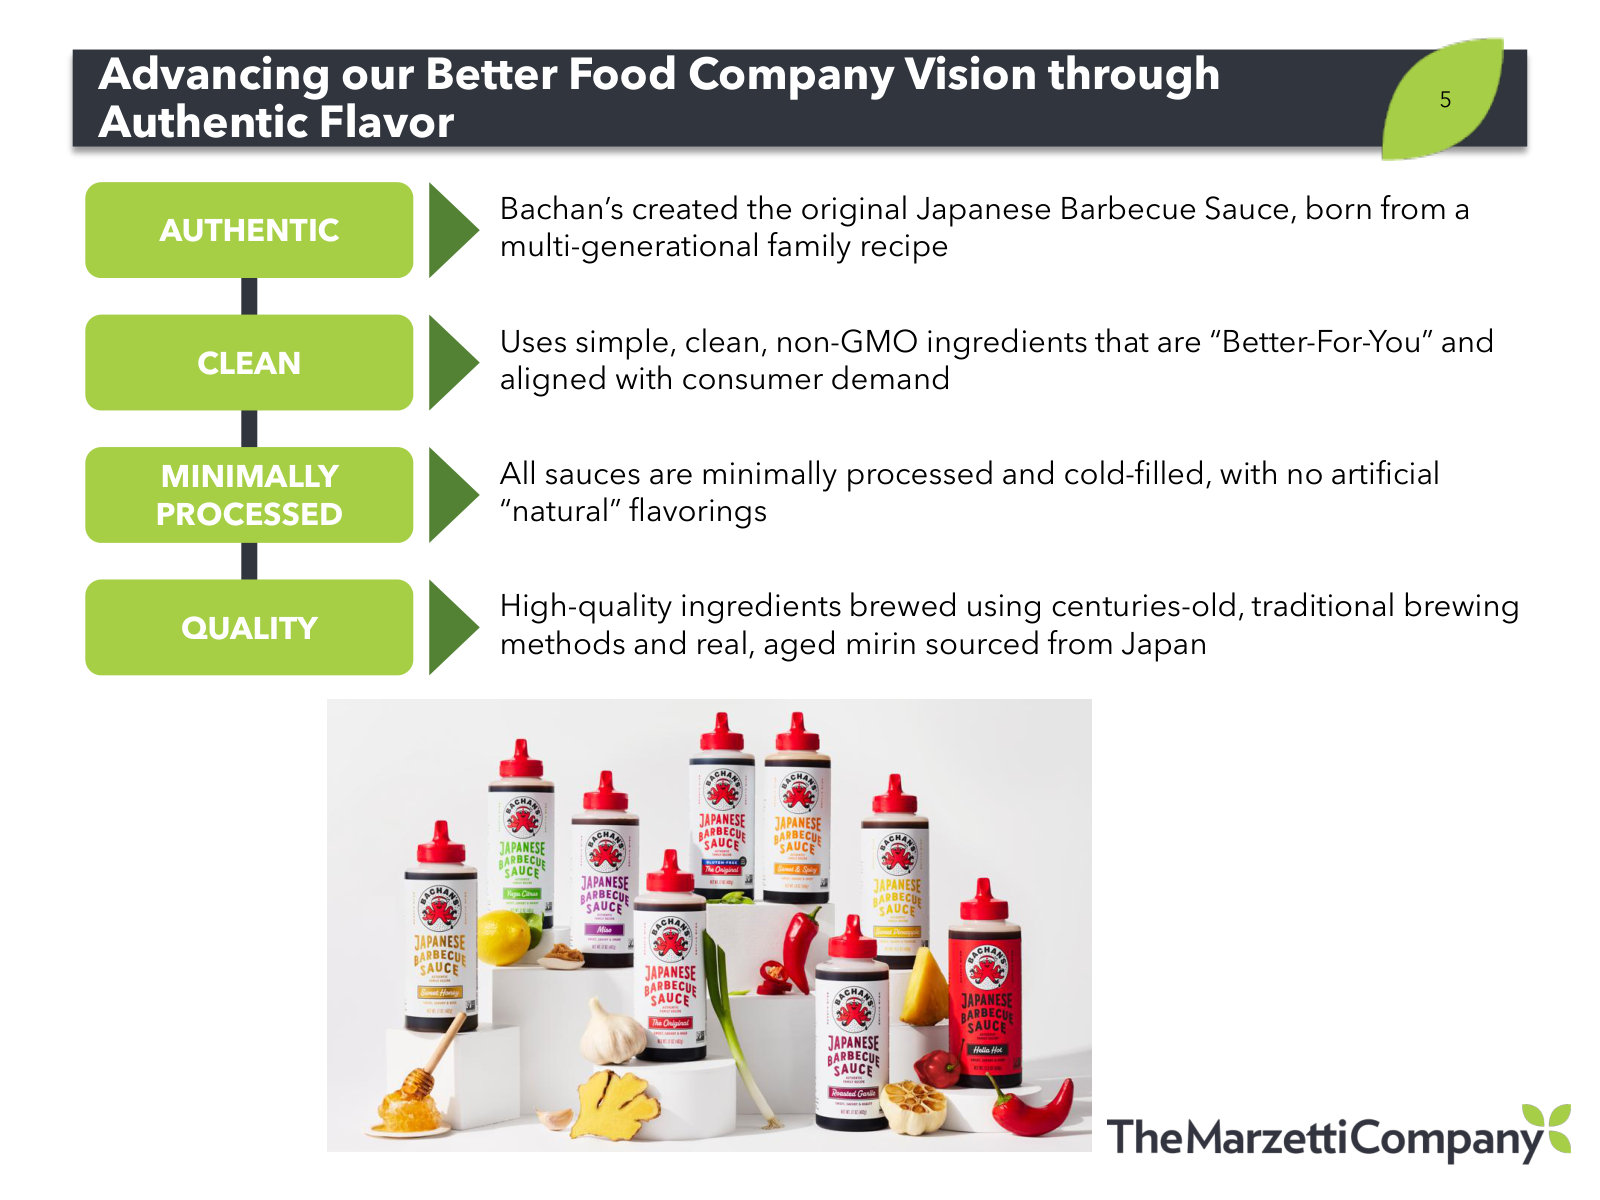
Planned Acquisition of Bachan's, Inc. — February 2026
The standalone deal deck for the $400m Bachan's acquisition - the only document that states the price and the original rationale. · Open the full document →
More from management
Investor Presentation - March 2026 — March 2026 · 50 pages · The same overview deck while Bachan's was still pending, with first-half FY26 financials. · Open →
FY26 Q2 Earnings Presentation — FY26 Q2 · 16 pages · The December-quarter results, reported the same day the Bachan's acquisition was announced. · Open →
Stephens Investment Conference - November 2025 — November 2025 · 48 pages · The conference version of the story just after the rename, before Bachan's entered the plan. · Open →
Investor Presentation - September 2025 — September 2025 · 45 pages · The first overview deck under the Marzetti name, with full FY25 numbers as originally presented. · Open →
FY25 Q4 Earnings Presentation — FY25 Q4 · 16 pages · Fiscal 2025 full-year results and management's explanation of the Lancaster Colony to Marzetti rebranding. · Open →
Investor Presentation - June 2025 — June 2025 · 45 pages · The last overview deck presented as Lancaster Colony, for comparing the strategy language before the rename. · Open →
Stephens Investment Conference - November 2024 — November 2024 · 44 pages · A two-year-old baseline: the growth and supply chain plans set out before the Atlanta plant and Bachan's. · Open →
The Marzetti Company's management answers for the business every quarter. These are the exchanges that explain it best — verbatim, from the call transcripts preserved in Sources. Each link opens the full transcript at that page in a new tab.
Q3 FY2026 Earnings Call — Q3 FY2026
Bachan’s closes and management names “authentic flavors” as a third growth leg beside legacy and licensed brands. · Open the full transcript →
Sauces, dressings and dips are now two-thirds of sales — the portfolio the company is deliberately concentrating into.
David A. Ciesinski (President and CEO): This acquisition strategically expands our portfolio of leading sauces, dressings, and dip brands that now represent twothirds of our consolidated net sales. It also specifically strengthens our portfolio of sauces, which alone account for nearly 40% of our consolidated net sales. In the era of M&A and GLP-1s, we believe consumers will continue to seek flavor enhancements for their meals. We believe our deep culinary expertise and focused scale in these categories positions us well to support the continued growth of Bachan's as well as our other brands.
p. 2 · Read in context →
How a soybean-oil spike travels: hedged coverage plus retail pricing, versus mark-to-market pass-through in Foodservice.
James Ronald Salera (Stephens); David A. Ciesinski (President and CEO): Can you give us a sense for the duration of the coverage in place right now? I know there are a lot of moving pieces, but it is an important input that we get questions from investors about. As you are doing demand forecasting and procurement planning for 2027, how does the recent run-up impact the mix and the margin outlook? […] We have what I would call intermediate-term coverage that takes us through essentially the end of the summer on board and basis, which should be more than enough time for us to be able to get into the marketplace and implement pricing. Our Retail team is in the throes of putting those plans together right now, and in the case of private label, we have already begun to see the market start to move within the last few weeks. We feel like we are in a much better position as it pertains to that than we were in 2022, the last time we saw a spike. On the Foodservice business, as you recall, it is a mark-to-market process where we have some of our national account customers that have taken positions, some that are a little closer nearby, but independent of that, the pricing differential is passed through. For you and others that track us, the key watch is our coverage on Retail, and we feel like we are in a strong position relative to where we were in 2022.
p. 4 · Read in context →
Why scanner strength and shipped volume diverged — weather, category softness, and lapping last year’s pipeline builds.
Alton Kemp Stump (Loop Capital); David A. Ciesinski (President and CEO): First, sell-through data was once again very strong for both your frozen dinner rolls and for Chick-fil-A, yet overall Retail segment sales were down. What were the key areas of weakness as you look at your just over 5% volume decline in the quarter in Retail? […] I will point to three things. One is January and February weather resulted in the Northeast being particularly hard hit. The second is category softness in both produce dressings as well as pourable dressings, where the category is down about five points. The third is that we are lapping the pipeline build of both Chick-fil-A into the club channel and Texas Roadhouse rolls. Those three things combined drove the volume decline. In terms of surprises versus our expectations, weather is difficult to plan for. Regarding the launch of our Roadhouse rolls, velocities in Walmart continue to be particularly strong. It has taken us a little bit longer to build the quality of distribution that we want in Retail, so those velocities are lagging a little bit outside of Walmart. But overall, I would ladder back to January/February weather, roughly five-point category softness in produce and refrigerated dressings, and lapping that prior pipeline build. The executional component we are focused on is continuing to drive improved velocities on Roadhouse in Retail in particular.
p. 5 · Read in context →
Club economics up close: a two-pack that sold consumers a year’s supply, and Costco moving Olive Garden to rotation.
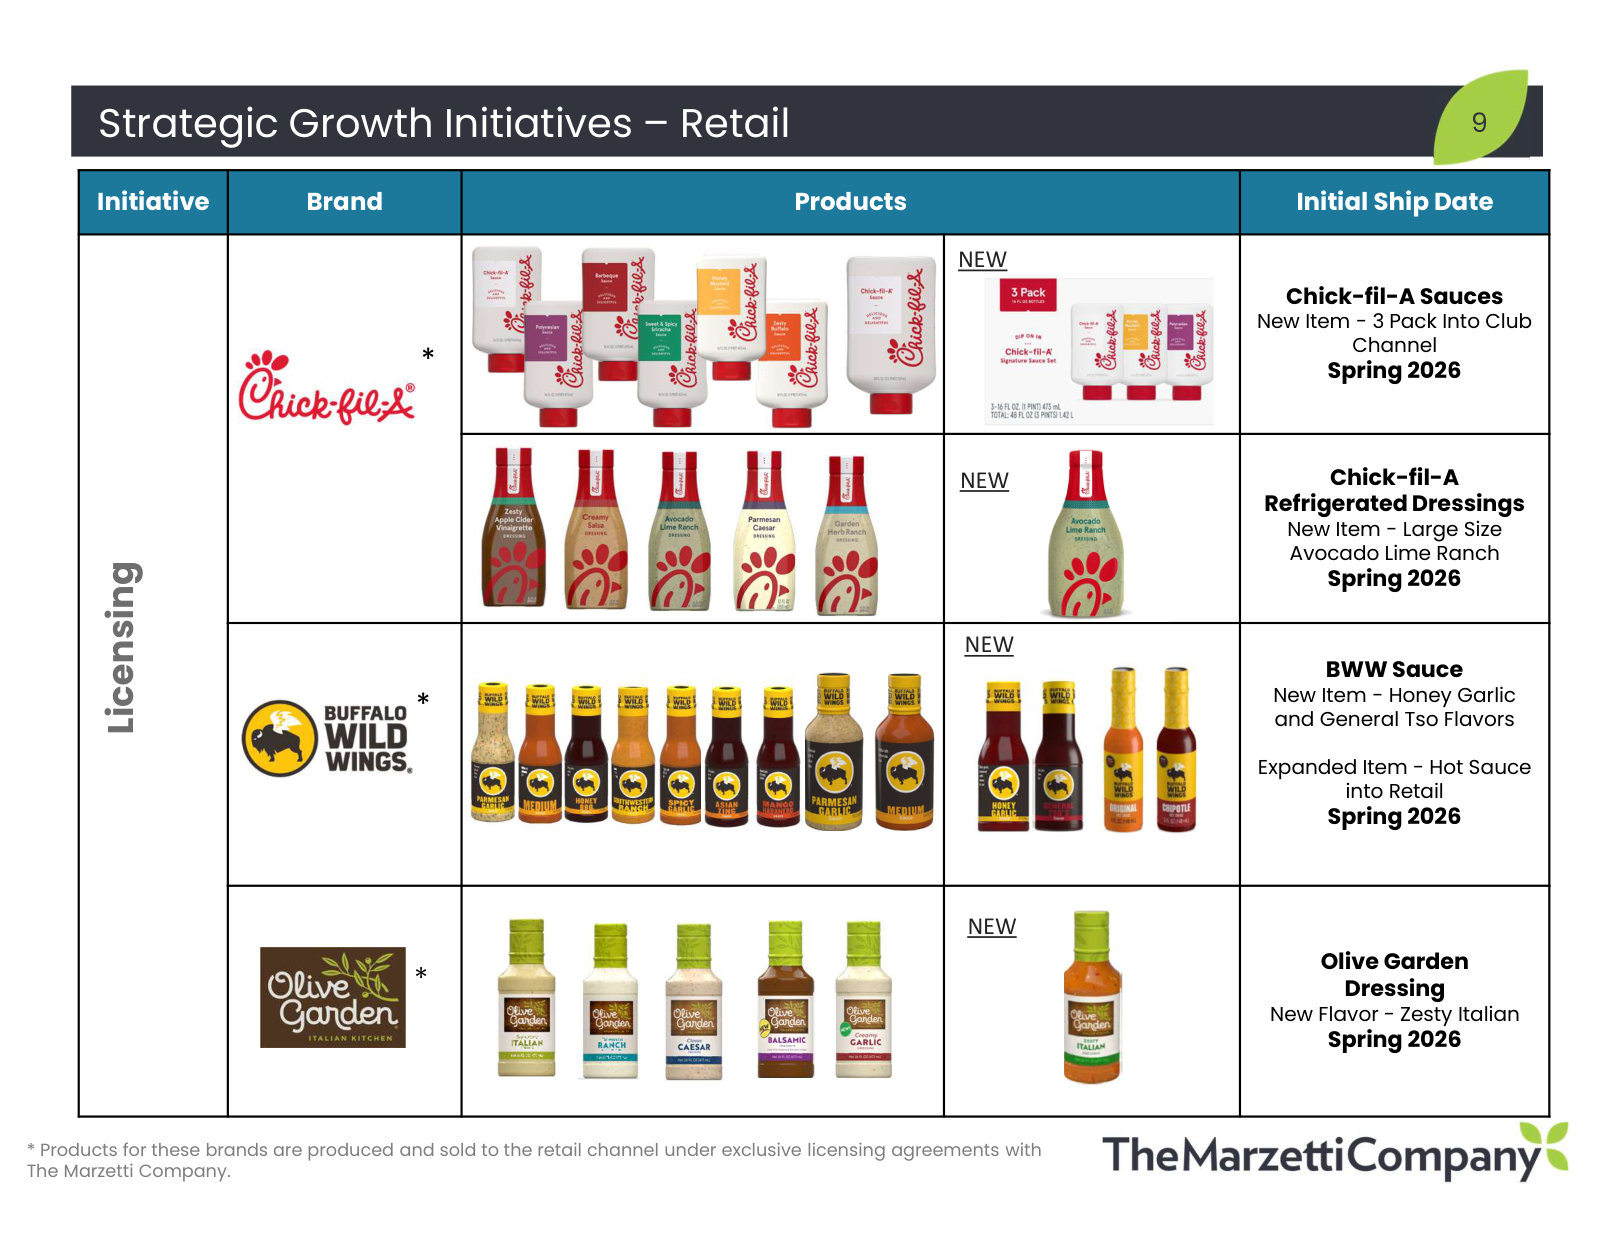
David A. Ciesinski (President and CEO): Good eye, but that is not the cause. The new item is really the response. Within club, there were two points of noise. One, we are lapping a launch of Chick-fil-A sauce last year, so we had a big pipeline build in the period. We went out with a two-pack of 20-ounce Chick-fil-A sauce. Sell-through was strong; however, buyers did not come back as quickly. When we did the math, we realized we were selling consumers about a year’s worth of supply of Chick-fil-A sauce. In conversations with the buyers at club, what we have elected to do is come back with a three-pack: two smaller originals and one Polynesian sauce, and that is shipping into the marketplace now. The other thing that happened is that, as you recall, we have been in club with our Olive Garden dressing for quite a long time with the exact same offering. A couple of Costco regions, not Sam’s, elected to move us from full-time distribution to more of a rotation. In response, we have retooled the offering to a multipack with the Original plus the Zesty, which we are bringing to the marketplace. We are working with our club partners to innovate and ensure that the offering is relevant. The Zesty is part of the response.
p. 6 · Read in context →
Foodservice is a bet on which chains win: national accounts are 75% of the segment and growth came from a handful of them.
David A. Ciesinski (President and CEO): Foodservice had a solid quarter where volume and sales were both up. If you look at the whole industry, it is essentially flat versus three months ago. Pulling that apart, in national accounts it bifurcates into concepts that are emerging as continuous winners and those that are struggling. Within our portfolio, we have a handful of performers that continue to do well. One of those is Chick-fil-A, doing well on their base business and behind several of their LTOs, which we have been fortunate enough to support. Taco Bell has also continued to emerge as a winner even in this economic environment. We have a handful of others that we are continuing to win with. On the other side, concepts that cannot lead with price or have an offering that is not connecting with consumers are struggling. Net-net, for our national accounts, which are 75% of our Foodservice business, we were able to grow, really led by Chick-fil-A and other winners, offset partially by some others. On our branded piece of the business, that was flattish and would have been up more were it not for our exit of a very low-margin breadstick business. Overall, in a competitive environment, we continue to do well. Part of it is we sell sauces, which continue to be where our partners look to differentiate their menus, and part is we are fortunate to have partners with big, strong concepts performing best in this environment.
p. 7 · Read in context →
Bachan’s unit economics: accretive at gross margin, below Retail at operating margin because awareness is still being bought.
Thomas K. Pigott (Chief Financial Officer): That is total operating margin. Again, we are being a little conservative at the onset. As we get into it, we know they are an invest-to-grow brand, so there is a higher level of marketing spend as they expand into markets and build awareness. It is a fantastic brand and a top brand in barbecue sauce, but awareness is relatively low. Their operating margins are slightly below our existing Retail due to the level of investment to sustain growth and build it out. At the gross margin level, Bachan's is nicely margin-accretive to the business. As we get into next quarter's call, we will have completed the planning process with the team and will have more to share. Everything we see in terms of their performance gives us comfort in our business model for what we can achieve with that acquisition.
p. 8 · Read in context →
Management’s own three-chapter history of the company, and where the next decade of growth is supposed to come from.
David A. Ciesinski (President and CEO): I believe that the acquisition of Bachan's is an opportune time to take a step back and take an inventory of where we have been, where we are, and where we look to go. Over the last ten years, if you have looked at the evolution of our company, we started as a company focused on driving our legacy brands and then added to that with our restaurant brand licenses. Over the last seven years, we have built out our Retail business by leaning into the growth of those licensed restaurant brands. As we sit today, it is about $550 million or so of Circana sales and about $350 million more than that of net sales, and it has been an important driver of our growth story. At the same time, we have leveraged our strong balance sheet to make key investments in our infrastructure, retiring old lines and putting in high-speed, more efficient lines, and putting in place scalable IT infrastructure. What Bachan's marks for us is not only the acquisition of a phenomenal brand and the opportunity to work with tremendously talented people, but the first of what we believe will be more acquisitions in an area that we are calling authentic flavors. Ten years ago, growth was driven by legacy brands—Marzetti, Sister Schubert’s, and New York. The more recent period has been driven by that plus restaurant brands. As we go forward, we are excited to add a whole new growth leg to our story: authentic flavors. Our aspirations are to continue to innovate, market, and grow against our legacy brands and our restaurant licensed brands, and also to use our end-to-end focused scale—from culinary to product development through the supply chain—to help highly relevant brands like Bachan's achieve their full potential in the marketplace. As we learn more about Bachan's and get successfully underway, we will look for other opportunities to leverage our balance sheet and find other authentic flavors where those brands and teams can come and take their business to the next level. Over the next ten years, this gives us a platform for a more balanced pathway to grow in Retail and in Foodservice.
p. 8 · Read in context →
Q2 FY2026 Earnings Call — Q2 FY2026
The Bachan’s deal is announced and defended — what was bought, why now, and how the $400 million is supposed to pay. · Open the full transcript →
The demand model for Foodservice, spelled out: gas prices, tax refunds, and winners taking share in a flat industry.
David A. Ciesinski (President and CEO): So at an overall industry level, I think the best way to categorize things is that essentially they're flat. We also saw a bit of a pullback in foodservice during the period of government shutdown. But there again, we saw an element of normalization. If you look at most of our large national accounts, we're continuing to win with those, AAA Domino's, Taco Bell, etc. I would say in those particular cases, you know, we were very satisfied with their performance and our performance. If you go back and you look at the script for probably the last couple of periods, we talked about the fact that we were going to be lapping a couple of limited-time offerings during this period that we thought were going to create a hole. I think that the setup that we used is we expected volume to be down a couple of points and for us to be able to get a little bit of pricing to get us closer to flat in the business. […] I think there are a couple of things that are working in our favor for everybody that services foodservice first. Gas prices are down year against year, which we know gives consumers discretionary spending that oftentimes comes back in away from home dining. The other thing that we're seeing here is like you, I think we're expecting income tax returns to be a little bit stronger this year than they were last year because of some of these changes. And those ordinarily hit around the time of President's weekend or so. So you put the fact that inflation remains relatively in check, gas prices seem to be moderating some. There's a case for slightly stronger income tax returns. I think the setup there for all of foodservice is at least for a flat scenario, if not for a modest improvement. And if past is prologue, what we see is that the winners continue to win in this environment.
p. 4 · Read in context →
The licensing engine in one number — Texas Roadhouse rolls tracking toward a $100 million retail run rate.
David A. Ciesinski (President and CEO): The business continues to maintain that same growth rate. If you look at it, you pointed out most recently, we exited about $20 million run rate. Actually, the five-week was better than the thirteen-week. And I think there's still room for us to continue to dial in the merchandising on the shelf. And, a range of other things. Parasitically, yesterday, I was on the phone with the team at Texas Roadhouse, and we were talking about partnership and how mutually excited we are about the whole thing. And we are also talking about other items that are in the pipeline. So, you know, you get to the end of our fiscal year, I think there's most certainly a case that this thing could be working towards a retail $100 million run rate. And this is an amazing brand. It's really one of those away from home brands that really connects with consumers in a good economy and in a tough economy. And, we feel like we're uniquely suited to work with them in their iconic role platform to grow the business.
p. 6 · Read in context →
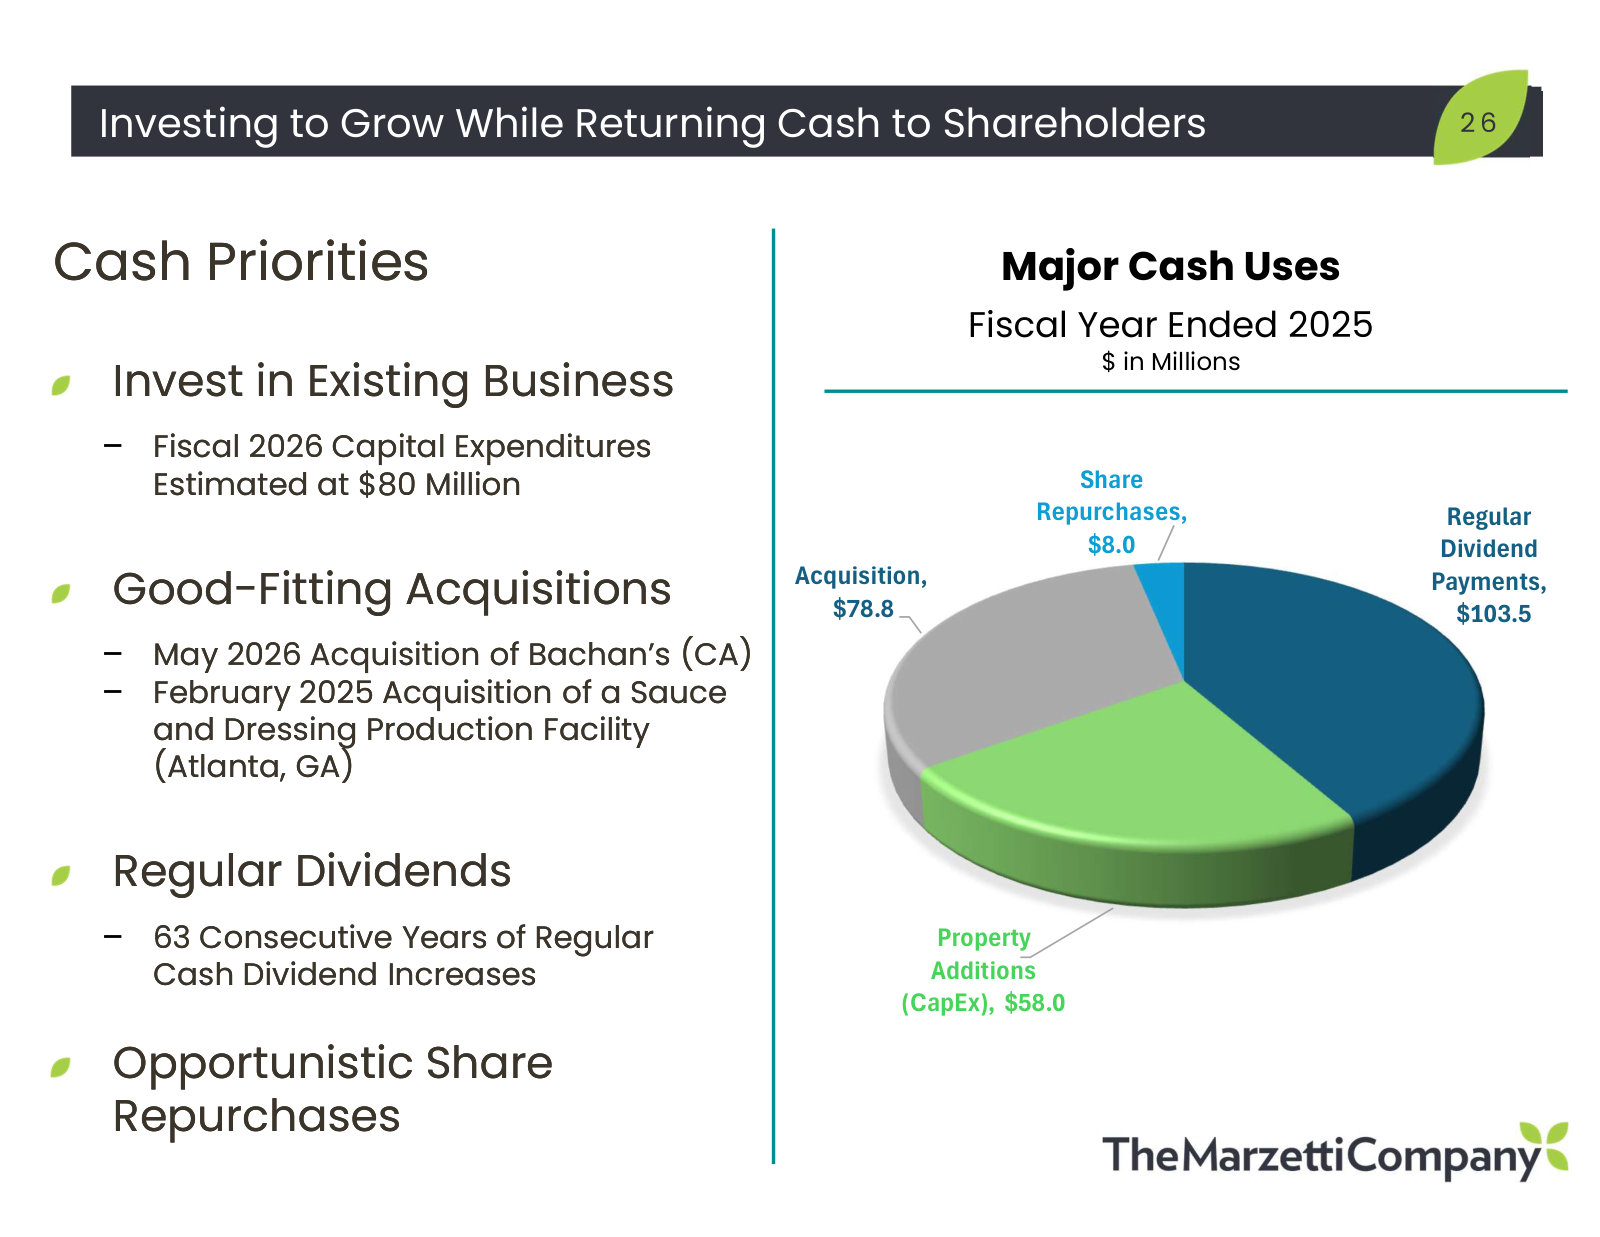
Capital allocation after the deal: buybacks revert to attritional, dividend growth stays on its 63-year track.
Thomas K. Pigott (CFO): So, you know, obviously, with the stock trading off and with the rest of the sector, we felt opportunistically there was an opportunity to buy back. So we executed a limited number of buybacks during the quarter. Now, as you've mentioned, we were levering that balance sheet against the acquisition of Bachan's which, you know, as Dave articulated, will be tremendously positive for our financials over time. So I think at this time, it's safe to say we'll kind of go back to our attritional approach on buybacks. That said, on the dividend policy, we continue to expect to grow it consistent with our history even with this acquisition given the very strong cash position the company has developed over time.
p. 7 · Read in context →
Bachan’s is 100% co-packed today — the supply-chain synergy case, and why they intend to go slow to go fast.
David A. Ciesinski (President and CEO): So as it stands today, the business is co-packed 100%. And, obviously, that provides us with a pathway to integrate some of the manufacturing into our network. But this is one of those scenarios where we most certainly wanna go slow to go fast. We wanna make sure we understand the business. We wanna make sure we understand how to manufacture the business. They have a good co-pack partner that's out there right now. And the last thing we wanna do is to bugger this thing up. But as you think about over the longer arc of time, there is a strong case for synergies here throughout the supply chain, and then we talked about the gross synergy case as well.
p. 9 · Read in context →
Where the accretion comes from: a premium price point plus Marzetti manufacturing, procurement and distribution.
David A. Ciesinski (President and CEO): So this is a very high-margin business. The product sells at a premium price point. Justifiably. And the existing margins are accretive to our existing retail segment at gros margin. So we're starting off with a premium product. And as we look at it, we have opportunities not only in terms of utilizing our capabilities in manufacturing, procurement, distribution, is another drill site for us. So this is gonna be immediately margin accretive to us at the gross margin level. With potential to add to that going forward.
p. 9 · Read in context →
Q4 FY2025 Earnings Call — Q4 FY2025
The annual call that states the growth algorithm outright and explains the single commodity that matters most. · Open the full transcript →
Why an EPA biofuels ruling moves Marzetti’s cost base — soybean oil and renewable diesel.
David A. Ciesinski (CEO): It's a significant element of our commodity basket. I'll start, and then Tom can provide more specifics. Over the last seven to eight years, we've seen soybean oil take on a larger role in renewable diesel. Towards the end of the Biden administration, there was some uncertainty about the volume of Renewable Volume Obligations as it pertains to renewable diesel. Earlier this summer, the EPA released guidelines that increased the diversion of soybean oil to renewable diesel, which resulted in a price spike. […] Typically, exceptions are made for small refiners, and if those exceptions continue, we could see commodity costs for soybean oil decline a bit further. Overall, this aligns with our expectations, so we do not anticipate it being a near-term obstacle for our business. We also hedge with our suppliers on this.
p. 4 · Read in context →
The marketing case in numbers: household penetration up 8 points on Texas Toast with a near-60% repeat rate.
David A. Ciesinski (CEO): We're currently seeing positive progress under our new marketing leader, who is effectively analyzing our data and utilizing our digital tools. We invested in targeted programs that enhanced our household penetration. Our market share increased in five out of our seven categories. For instance, our Texas Toast brand ended the quarter with a 43% market share, and its household penetration rose by 8 points, with a nearly 60% repeat rate. We believe that strategic marketing investments at reasonable costs can boost household penetration, which in turn helps retain consumers and supports sustained business growth. We applied this strategy across various products in a targeted way, and alongside innovation, we see it as crucial for achieving profitable volume growth.
p. 5 · Read in context →
What “cost savings” concretely means in FY26 — closing Milpitas, commissioning Atlanta, shifting volume to Horse Cave.
Thomas K. Pigott (CFO): The team performed exceptionally well in '25 by focusing on several key areas: achieving procurement savings, negotiating better contracts, and implementing value engineering to enhance product efficiency and reduce production costs. We also gained valuable insights into our costs thanks to the SAP implementation. Looking ahead to '26, we will add the network reset to our cost-saving initiatives. This involves closing the Milpitas facility and increasing operations at College Park, which will provide additional opportunities for cost savings. Currently, we are in the midst of this transition, decommissioning lines in California and commissioning new ones in Atlanta, while also shifting volume to Horse Cave. There's significant change happening in our networks, and we are managing it well. As we move into the latter half of fiscal '26, we expect to start seeing more benefits reflected in our margins as the year goes on.
p. 6 · Read in context →
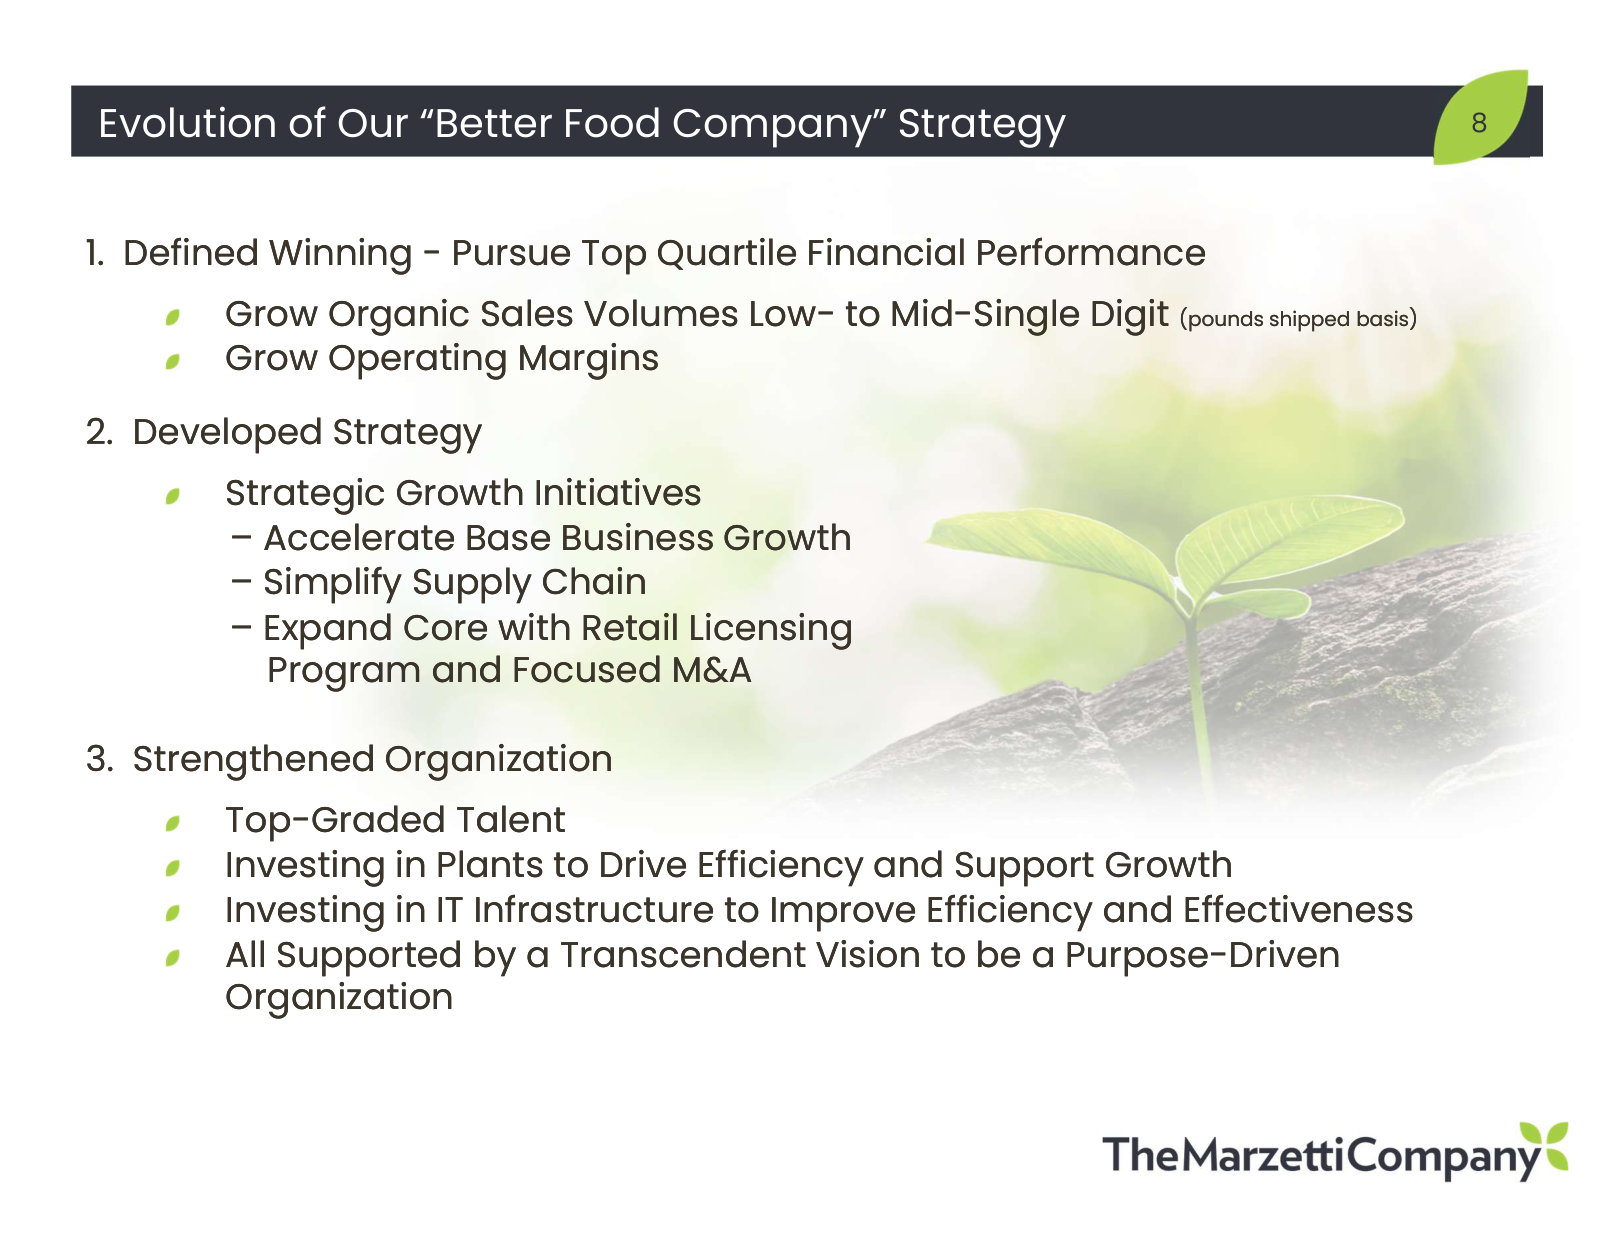
The growth algorithm stated plainly: low-single-digit sales, ~50bps of gross margin, mid-single-digit earnings.
Thomas K. Pigott (CFO); David A. Ciesinski (CEO): I'll just add, overall, I think we expect '26 just to be a continuation of our growth algorithm where we see revenue growing in the low single digit, really driven by volume in retail, and some pricing for the Ag commodity. Foodservice, I think we're looking at more of a flattish profile in '26. And then on the gross profit, we expect to continue to grow our margins probably in the around the 50 basis point range and SG&A, as I mentioned, growing with inflation. So that's kind of the broader outlook to how we're forecasting '26. […] Which gets us overall to low single digit on the top line, mid-single digit on the bottom line, sort of a continuation of our outlook for this year.
p. 7 · Read in context →
How to read Retail margins after a marketing step-up — no reset, flat to up in line with productivity.
Thomas K. Pigott (CFO); David A. Ciesinski (CEO): And you're right, we did choose to take advantage of some good potential programs to invest in, in the quarter, and it did impact Retail's profitability. There are a couple of other things I'll mention, and then I'll let Dave talk a little bit about the marketing spend. The other thing on Retail is we had a very difficult comp this particular quarter. The prior year quarter was a record Q4 on operating income for the Retail segment. And the other thing that impacted the profitability was this particular quarter, PNOC was a little bit negative due to the ag inflation in time, we expect that PNOC to balance out. […] So Scott, bringing around it, we don't expect a reset on marketing for the Retail segment. We saw an opportunity in this period to raise it. And I think as we continue to generate cost savings in other areas of the P&L, I think we're going to look for opportunities to plow some back into the business longer term. And I think, to Tom's point on this business, I would expect our operating margins to remain in line here. So if you're looking at both gross margins and operating margins over the foreseeable future, we expect those to be flat or grow in line with our productivity programs.
p. 8 · Read in context →
Q4 FY2024 Earnings Call (Lancaster Colony) — Q4 FY2024
The fullest account of how licensed products and limited-time offerings actually earn their margin, and where private label bites. · Open the full transcript →
Why limited-time offerings carry above-average margin — proprietary R&D up front and no competitive bid.
David A. Ciesinski (President and CEO): When you look at our LTOs, they're usually at or better than our line average because of all of the proprietary R&D work that goes upfront and ordinarily for those sorts of items, we wouldn't be bidding against other people. So as you think about that stream of work versus our base business, they're typically going to be margin accretive to what we're doing. I'm glad you asked the question about the dialog with our operators, as you might imagine.
They're focused on really two things. They're looking at their bottom line and cost — but I think they're really looking at what needs to be true for them to accelerate their traffic trends. And fortunately, we tend to get calls that are more focused on exciting menu items that they can feature in their advertising to drive traffic. And to that end, I would tell you that our phone is ringing as hard as it's been in any time in the recent past, because the number of people that we work with are ones that we have and are looking for things that they can talk about in their advertising. Most don't want to be discounting on their menu because their margins are already under pressure, because of labor and other things. And I think they're trying to figure out how they drive traffic through menu excitement and it really plays into our wheelhouse.
p. 5 · Read in context →
A category-by-category read on private-label exposure, from refrigerated dressings to croutons.
David A. Ciesinski (President and CEO): More broadly, as we're looking at our price points, I think you're precisely right, we're watching private label, so we watch our gap versus private label. Then in key seasons like Sister Schubert, we're looking at those promoted price points. As we scan across all of our categories, what I would tell you is if you look at refrigerated dressings, private label really isn't much of a threat. If you go to pourable salad dressing, we've continued to hang in there. We're continuing to outperform the category and we're growing share in the period. Private label is growing. But what we're probably seeing in that case is a trade down from some of the other more value oriented brands to private label, which doesn't seem to be impacting us. You go around, you look at Toast, we feel like we're well positioned. Sister Schubert is a brand that we'll watch. We'll watch croutons as well. Refrigerated dips, we feel like we're insulated there. So generally, I continue to feel like our exposure in private label is more modest than our peers. But we still need to keep an extremely sharp eye on value to make sure that we're relevant.
p. 5 · Read in context →
Two years before Bachan’s, the stated preconditions for M&A: ERP live, Horse Cave running, cash building.
David A. Ciesinski (President and CEO): If you go back over the last two years, we've gone live on ERP, we finished all of our waves; we lapped the last wave, our fifth wave in September. So ERP is, as Tom mentioned, essentially drawn down. Horse Cave is up and running. You look at our cash balances for the end of the quarter, they continue to build. This business generates — has the ability to generate a lot of cash. I think we're in a position now to lift and shift our focus and start to look at that source of inorganic growth. You can expect to hear more from us on that as we progress through this year, because we feel like we have the team, we have that strong balance sheet, we have assets that will allow us to pursue focused scale that will allow us to compete against even the mega caps within narrow categories like sauces and dressings and we're looking forward to that next chapter of our growth.
p. 7 · Read in context →
The consumer thesis behind the pricing discipline — and the refusal to win on price alone.
David A. Ciesinski (President and CEO): Look at what underlies this whole thing: I think broadly is that consumers are in the midst of a sustained unrelenting squeeze. That affects 60% of households, including households making over $100,000, where after years of inflation that exceeded wage growth, they found themselves upside down and they bridged it initially with COVID savings. Once those were extended, they turned to credit cards. Credit card debt has grown now on average to about $6,000. The interest payment on that per month is about $200. Put that all together and consumers are really trimming their sails and trying to balance their sources and uses, and they're looking for value. But they're also looking for affordable luxury in small things to make their days go better. Our view internally here i that we think we're going to be in this environment for some time and nothing magically is going to fix it. So it's a combination of watching value, but we're not going to win solely on price. We will leverage our innovation as a means to continue to bring good items into the marketplace at the right price point that allow us to outperform peers over the long haul. It feels like an appropriate strategy in this environment.
p. 10 · Read in context →
The continuous-improvement program sized: historically about $20 million a year, now targeted above that.
David A. Ciesinski (President and CEO): What I'm prepared to share is if you go back to the early days of our continuous improvement program before COVID and before ERP, we used to talk about saving $20 million a year. Then we suspended that as we focused on construction projects and ERP, and now we've brought that back. We've taken the target up that our team is pursuing north of what we used to pursue and we feel like it's achievable.
p. 11 · Read in context →
An innovation with IP behind it — why patented gluten-free Texas Toast is incremental rather than cannibalizing.
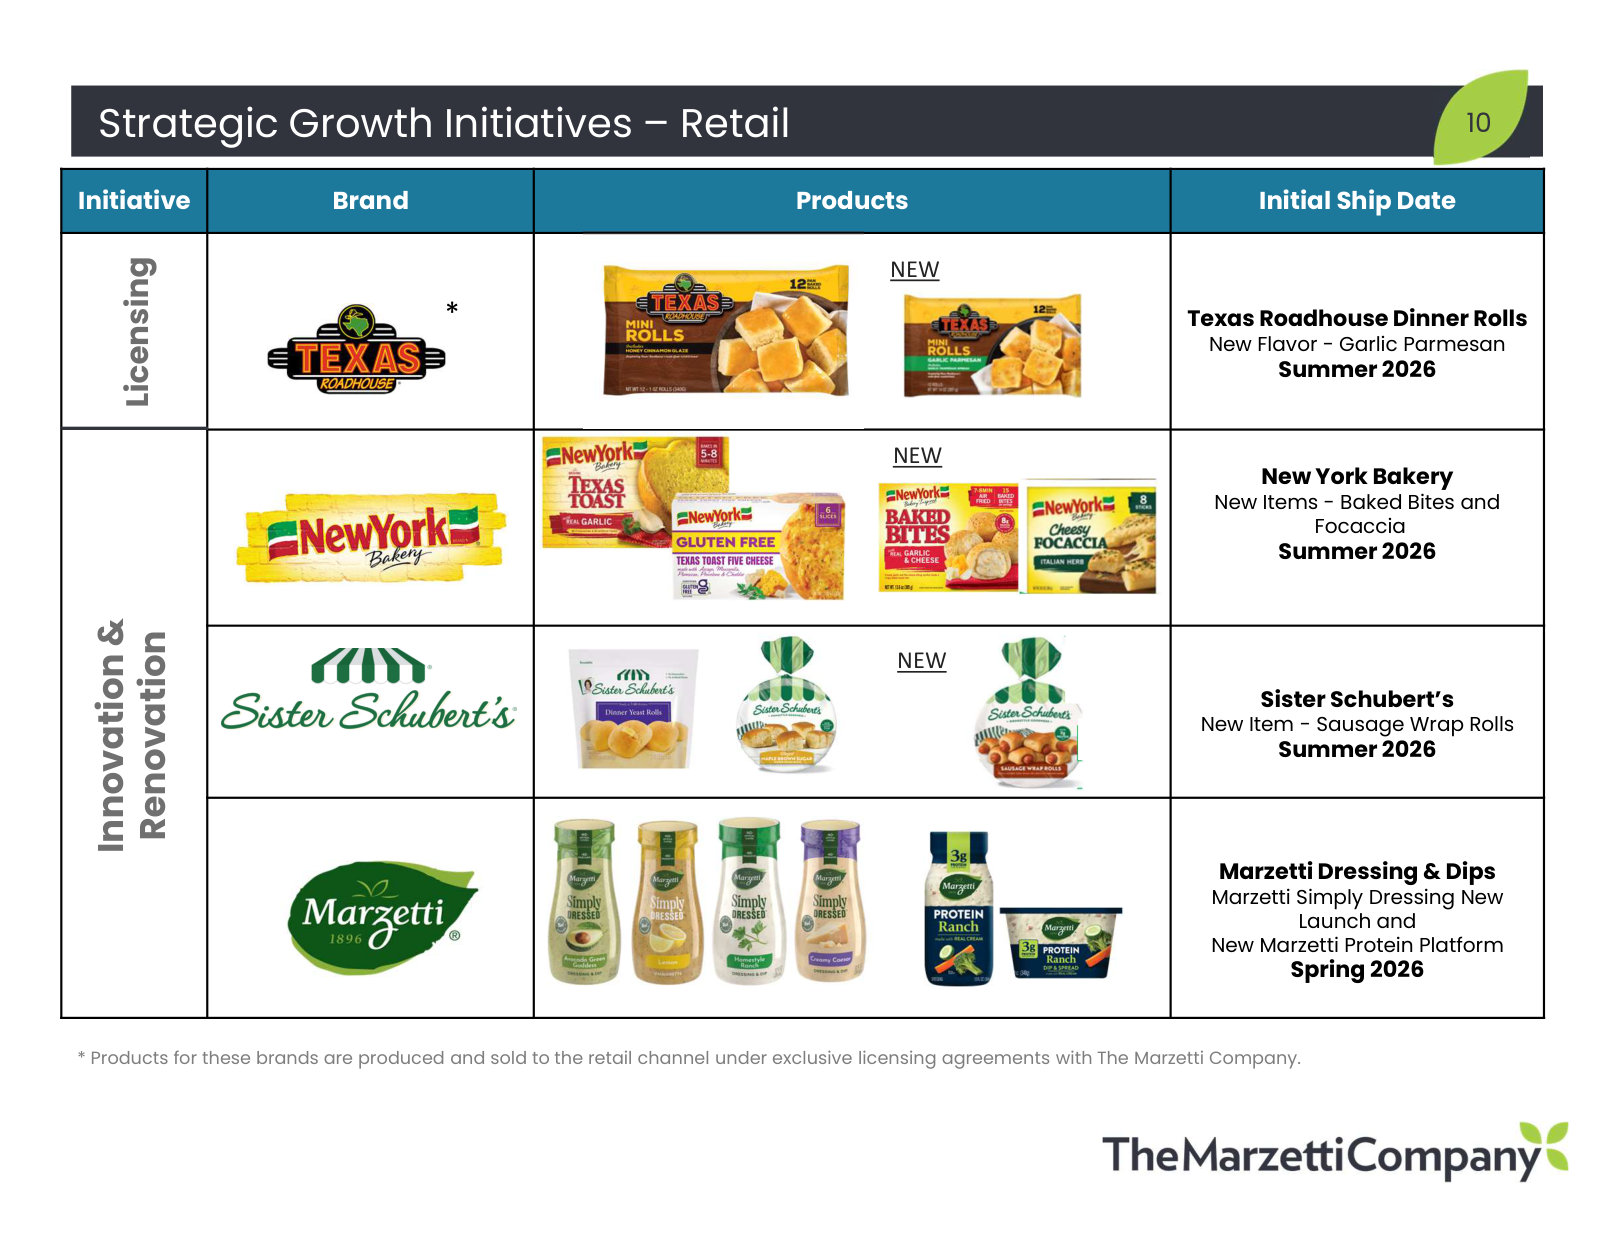
David A. Ciesinski (President and CEO): Maybe starting first with the product: it's amazing. It's a product that we developed and w actually got a patent on the technology, because if you've tried gluten free bread products, a lot of times they're very spongy or they have an off note in the flavor. These taste nearly identical to our current item, and that's part of the reason why we're so excited about it. Versus private label, this is one where I think we're somewhat isolated. For us, these are consumers that were gluten intolerant or had celiacs where they weren't able to buy our products previously. So for us, it's incremental. The items that are out there today, both the brands and the private label, generally don't taste very good. I've spent a lot of time in the last quarter sampling Texas Toast, gluten free and non-gluten free as we've gotten the products ready for launch, and these are really great products. I'm thrilled to have IP and the flavor. The pricing on this thing is very much in line with similar gluten free products out there. So I think we can win on taste and on value. We're also looking for a platform opportunity to potentially use this technology or similar technologies we're patenting to look for other gluten free items, because it's a very big addressable opportunity that we just haven't played in before.
p. 11 · Read in context →
Q3 FY2024 Earnings Call (Lancaster Colony) — Q3 FY2024
A post-mortem on two acquisitions that failed, plus the clearest statement of how licensed brands are actually managed. · Open the full transcript →
The structural hedge between segments — and why slowing restaurant traffic generates innovation calls rather than losses.
Dave Ciesinski (President and CEO): One is, as consumers become concerned about away from home dining and they eat at home, it typically endures to the benefit of our portfolio. As we look at what's happening away from home though, importantly, as traffic starts to moderate at any one of our concepts, or really any operator's concept period, they typically will back off and say, what do we need to do to drive traffic back into these stores? And it really creates an intense period of innovation for a lot of these operators. And if passed this prologue, we get those calls, and we work with them on signature items, signature sauces that they can advertise to drive traffic back into the store. What I would share with you, Connor, is that, we're already starting to see that activity happen and we're already engaged in those sorts of discussions with our operators.
p. 7 · Read in context →
How commodity deflation gets recycled into trade spend, and why household penetration is treated as an annuity.
Dave Ciesinski (President and CEO): A couple of things that we'll share with you. Tom, I think nicely pointed out that we are seeing favorable PNOC as commodities have backed off. That's given us the incremental firepower to step into the consumer part of the business, the retail business, and to do a couple of things. I mentioned the fact that in these times consumers take themselves off autopilot and they start to look at more carefully what they're buying. In some cases it's a price point, in other cases it might be a gap versus private label or even a promoted price point. And what we're doing is using the benefit that we're seeing from the PNOC deflation to strategically invest back to make sure that as consumers come off autopilot and they're making these choices, we're still getting converted into the basket. So that was really one component of the spend. But the other thing is, really as you look longer term, we have some great brands in our portfolio, both our own core brands and our licensed brands that we think have the opportunity to drive significantly more household penetration. So some of the investment that we're driving this period behind a range of brands to include things like Chick-fil-A and others were intended to help us drive household penetration, because if we can get it into the basket and we can get it at home and get consumers to try it, our repeat rates on these products are extremely high and we think it's in our strategic best interest to continue to drive that process. So really two components of what we're doing ultimately funded by PNOC deflation. One part is just being really shrewd about managing our price points. But the second is, while we have the opportunity, let's invest to drive that penetration, because we know once we get them converted, it becomes — if we treat them right, it becomes an annuity.
p. 7 · Read in context →
Foodservice concentration and the chicken megatrend — why customer mix, not share gains, drove the growth.
Dave Ciesinski (President and CEO): Maybe I'll start by setting the context. About 75% of our business are large national chain restaurant accounts. And we enjoyed growth in the period both on the branded side, which is our own products, where we are picking up share. This would be Marzetti items sold up and down the street. As we look at what's happening on the restaurant side, what I can tell you is that, we continue to believe that we have a favorable portfolio of customers that's allowing us to grow better than the average today. That's what's really driving it. As far as sort of an account by account basis, are we picking up share, are we not? There really haven't been many changes there. And I think really the bigger point that we're seeing, and then Jim, this is an important way to think about it going forward is that, we continue to believe that chicken is having its moment. If you look at the mix of growth that's happening in QSR today, it's really focused around concepts that are selling chicken and whether it's Chick-fil-A which has been doing it enormously well since 1982 or any one of a number of other operators. That seems to be where the growth is. If you sort of pull apart and we have the data, we looked at sort of the share of pizza and burgers and chicken. Even if you look 52-week, 12-week, and 4-week, chicken continues to drive share even within the year. In one of your reports, you did a nice job of pointing out the long-term trends towards chicken. We're seeing that even in a little bit more of a challenging environment continuing to play out. And we believe that we sit in a good spot. We have the right capabilities and those are capabilities we want to continue to leverage with those operators so they can offer consumer relevant items to their customers.
p. 10 · Read in context →
The headroom argument for licensed brands, measured in household penetration rather than shelf space.
Dave Ciesinski (President and CEO): I mentioned that if you look at Chick-fil-A, one of the important points we would point to, on a 52-week basis today, Chickfil-A's household penetration is only 10.5%. Our own New York Bakery garlic bread is almost a 19% household penetration. So we feel like there continues to be a lot of opportunity to drive household penetration. If you look at the number of consumers that visit Chick-fil-A restaurants, I mean, it's probably three times what that number is, if not higher than that. So again, just taking that brand close in, we believe there's plenty of room to continue to build household penetration on the core. We think that Chick-fil-A brand has big shoulders and there are other sauces and dressings that we could launch behind that.
p. 12 · Read in context →
The brand-management playbook applied brand by brand: penetration for one, assortment for another, sizing for a third.
Dave Ciesinski (President and CEO): Really early days, we launched into Italian. Then we moved into ranch. As we entered into ranch, we were able to get more facings on the shelf, which improved velocity for all of the items. We came out behind that with Caesar, which has performed very, very well. And then most recently out with a Balsamic. So in some brands, it's just driving penetration and getting sizing right. I think that's the case with Chick-fil-A, because that brand just has big shoulders, like a Heinz Ketchup, for example. In the case of an Olive Garden, the way you manage a brand like that is, you drive assortment. And we think that the Olive Garden brand continues to have more room to continue to grow as well. Buffalo Wild Wings, it's kind of a combination of the two. We think there's more different flavor dimensions that we can go out with, but most recently now we're taking some of their best selling items and we're converting those to larger sizes. So whether Tom or me or any one of a number of people on our team, we all grew up managing big brands. I spent time at Heinz and Kraft and worked on Blue Box and Heinz Ketchup. And most of our team comes from bigger companies like that. And in essence, what we're doing is we're using the same sort of playbook tailored for each of these brands to help them uniquely grow. But with our existing partners, we think that there's plenty more room to continue to grow.
p. 13 · Read in context →
More calls
Q1 FY2026 Earnings Call — Q1 FY2026 · 6 pages · Go here for the mechanics of Foodservice pricing: quarterly mark-to-market on key ingredients across the 75% of the segment that is national accounts, plus the five-year arc of the Chick-fil-A license. · Open →
Q3 FY2025 Earnings Call — Q3 FY2025 · 8 pages · The best competitive walk-through in the set: private-label threat category by category, why a yellow shelf tag fails the return test while an end cap does not, and what the club channel is worth to a mature sauce brand. · Open →
Q2 FY2025 Earnings Call — Q2 FY2025 · 11 pages · The rationale for buying the Atlanta sauce and dressing plant — capacity, customer proximity and business continuity — and the pension termination that distorted reported EPS. · Open →
Q1 FY2025 Earnings Call — Q1 FY2025 · 12 pages · Read this for why Foodservice segment profit lagged its volume — labor, outsourcing and trade-system investment — and how a twelve-year-old Olive Garden license still growing is used as a pitch to new partners. · Open →
Q2 FY2024 Earnings Call (Lancaster Colony) — Q2 FY2024 · 11 pages · The origin story of the licensing model, from Olive Garden onward, and a rare look at surgical price-point management: the Olive Garden 16-ounce entry price, the Sister Schubert’s promoted price point, and roll down-weighting. · Open →
Q1 FY2024 Earnings Call (Lancaster Colony) — Q1 FY2024 · 7 pages · The moment the inflation cycle turned neutral: management explains why retailers were asking for promotion rather than list-price cuts, and what that meant for the margin outlook. · Open →
Q4 FY2023 Earnings Call (Lancaster Colony) — Q4 FY2023 · 15 pages · The peak of the pricing-led era, and the cost of building it: SAP go-live distortions and Horse Cave start-up costs that held back gross profit. · Open →
Q4 FY2021 Earnings Call (Lancaster Colony) — Q4 FY2021 · 13 pages · The baseline for the pricing playbook: how retail price increases were negotiated ahead of the 2022 inflation spike, and how Foodservice contracts adjust for commodity and freight. · Open →
The Marzetti Company's annual reports contain management's most considered account of the business. These are the sections, passages and visual pages worth opening in the originals preserved in Sources.
The Marzetti Company — FY2025 Annual Report (Form 10-K) — FY2025
First 10-K under the Marzetti name, and the fullest account of a two-segment food business where two customers carry nearly half of sales. · Open the full document →
Item 1. Business — p. 5 · Read the full section →
Management's own framing of what the company is after the June 2025 rename from Lancaster Colony.
Why the Lancaster Colony name was retired and what the company says it now is.
Reflecting the evolution and growth of our company, Lancaster Colony Corporation changed its name to The Marzetti Company effective June 27, 2025. Since the divestiture of our last non-food businesses in 2014, Lancaster Colony Corporation operated as a food-only business best-known by our customers, licensing partners, suppliers, and employees as Marzetti. […] The Marzetti Company, an Ohio corporation, is a manufacturer and marketer of specialty food products for the retail and foodservice channels.
p. 5 · Read in context →
Description of and Financial Information About Business Segments — p. 5 · Read the full section →
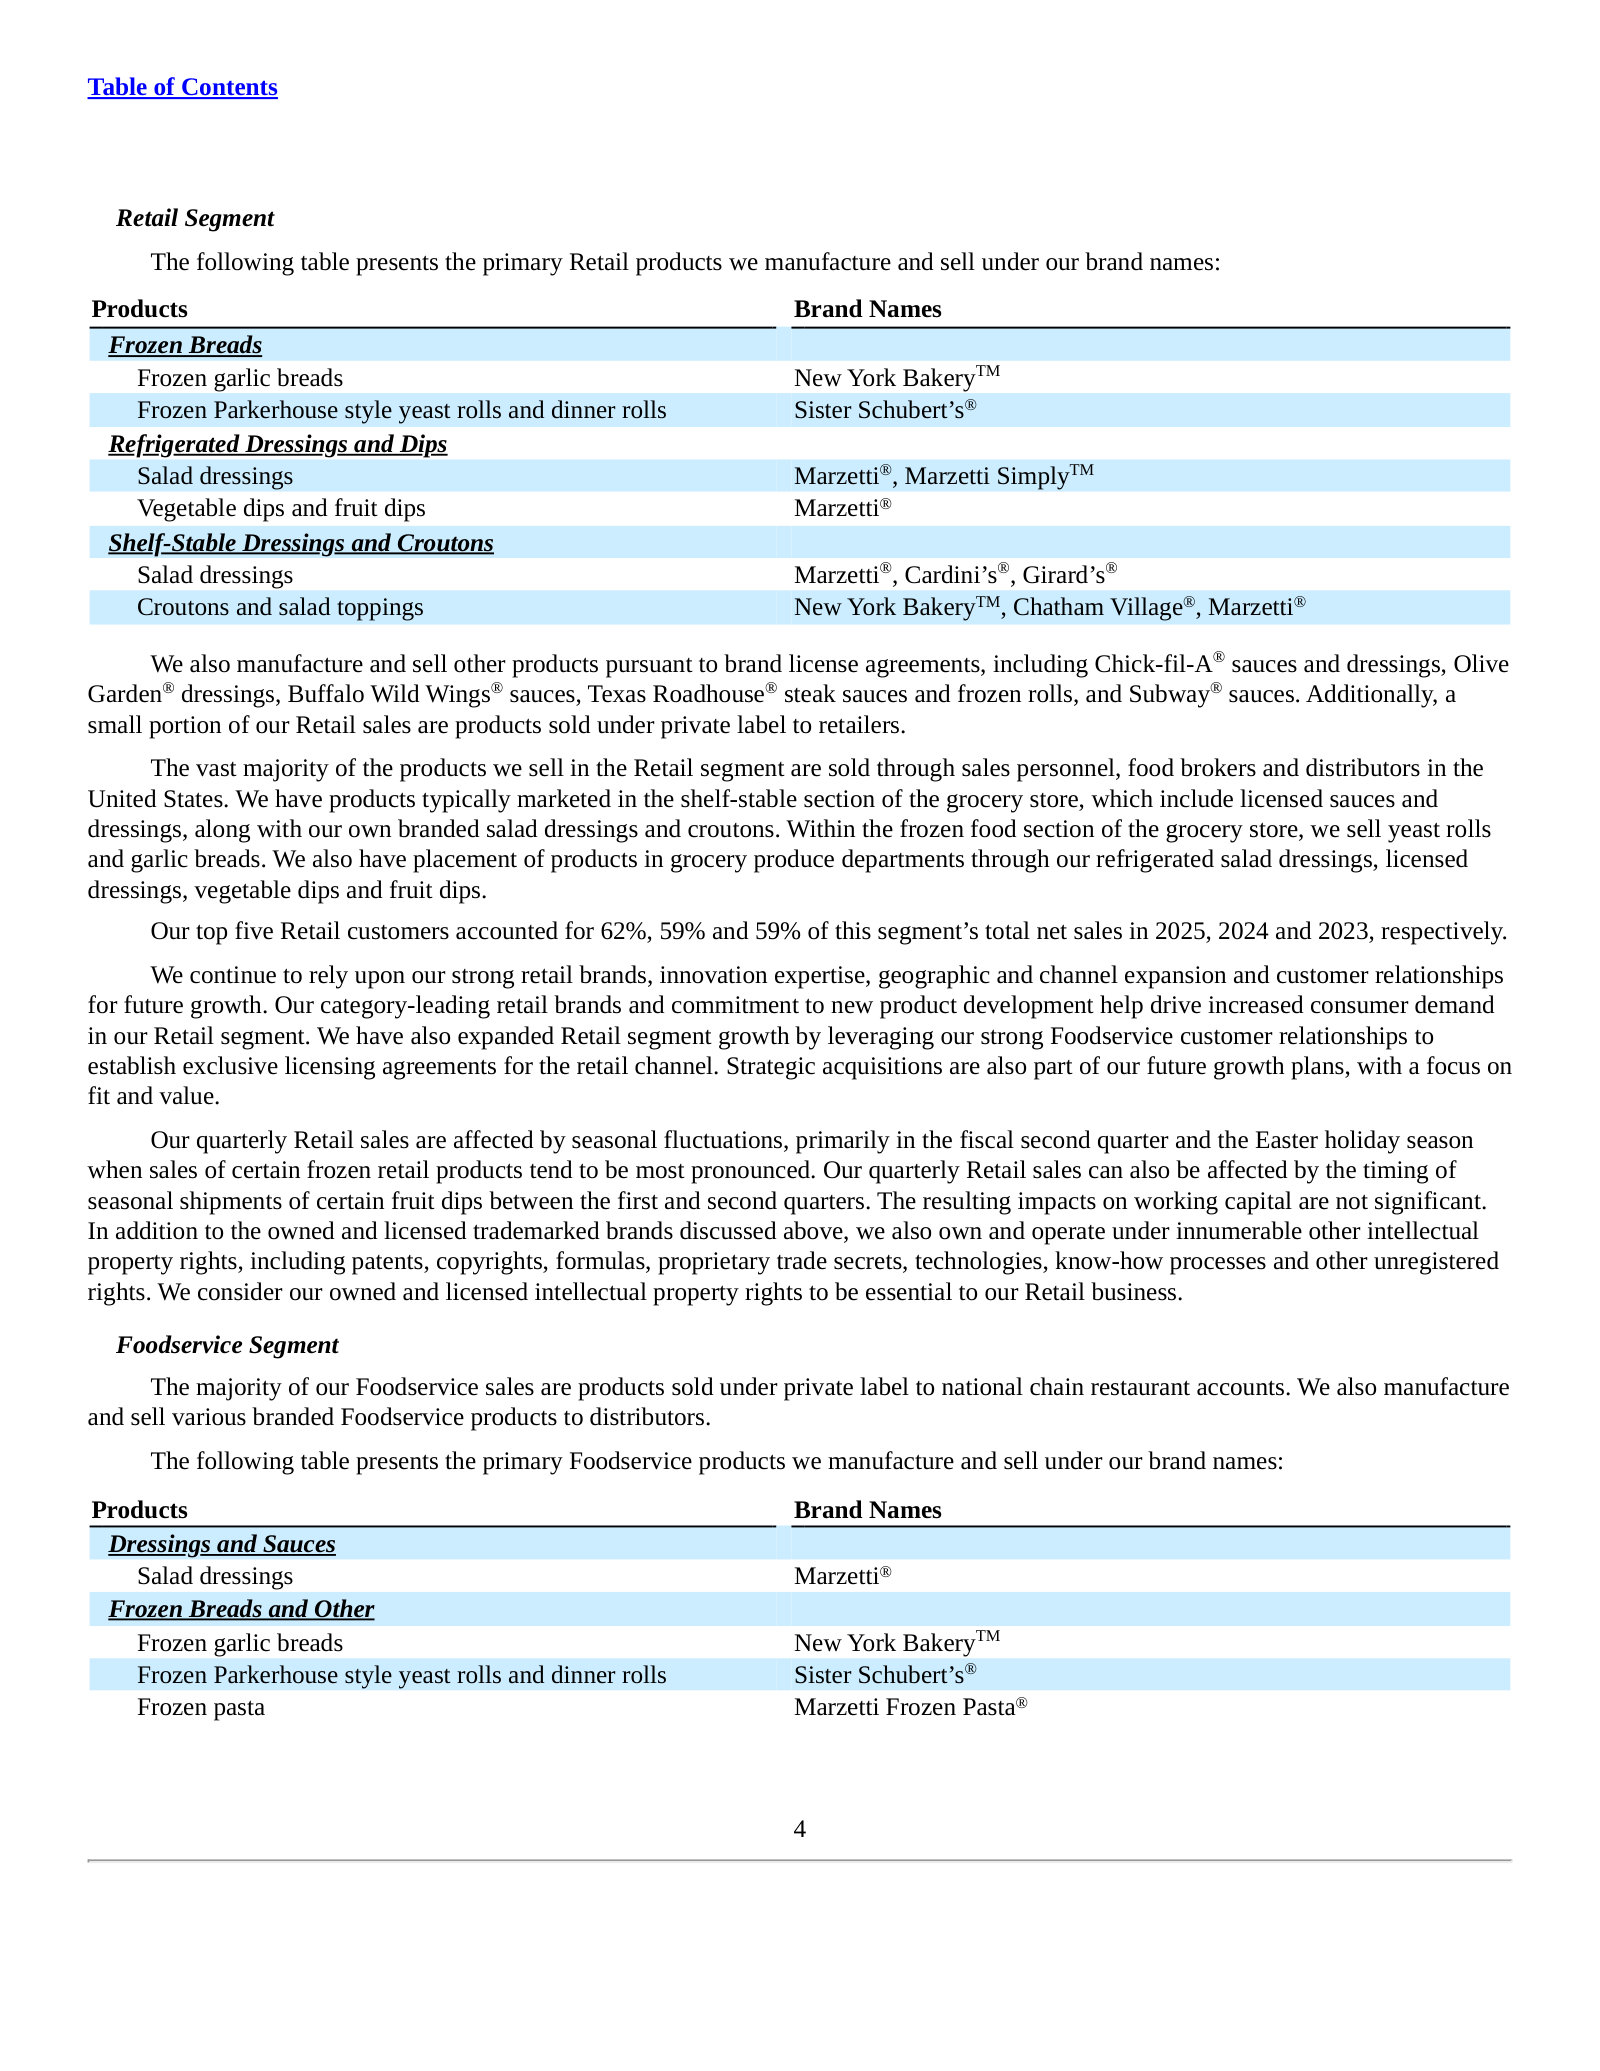
The two segments are built on the same plants but sell in opposite ways — branded shelf space versus private-label chain supply.
Net Sales Attributed to Significant Customer Relationships — p. 7 · Read the full section →
The defining fact of the business: two relationships account for roughly half of consolidated net sales.
Walmart and Chick-fil-A as a share of consolidated net sales, three years.
Net sales attributed to Walmart Inc. (“Walmart”) totaled 19%, 18% and 18% of consolidated net sales for 2025, 2024 and 2023, respectively. […] Total net sales attributed to Chick-fil-A, including the Retail sales resulting from the exclusive license agreement and the Foodservice sales, totaled 29%, 28% and 26% of consolidated net sales for 2025, 2024 and 2023, respectively.
p. 7 · Read in context →
We manufacture and sell numerous products pursuant to license agreements and failure to maintain or renew these agreements could adversely affect our business. — p. 16 · Read the full section →
The licensing program is the stated Retail growth engine, and the agreements behind it are short-dated and cancellable.
Terms on which the brand licences that drive Retail growth can end.
Our brand license agreements are typically for a fixed term with no automatic renewal options or provisions. We cannot ensure that we will maintain good relationships with our brand licensors or that we will be able to renew any of our license agreements upon expiration. Our key brand license agreements can be terminated or not renewed at the option of the licensor upon short notice to us.
p. 16 · Read in context →
Chick-fil-A represents a significant portion of our Foodservice segment sales. — p. 17 · Read the full section →
Quantifies the largest single dependency and notes there is no contractual commitment behind it.
Item 7. Management's Discussion and Analysis — Net Sales — p. 29 · Read the full section →
Management decomposes a 2.0% sales increase into core volume, the exited bakery lines and a temporary supply agreement.
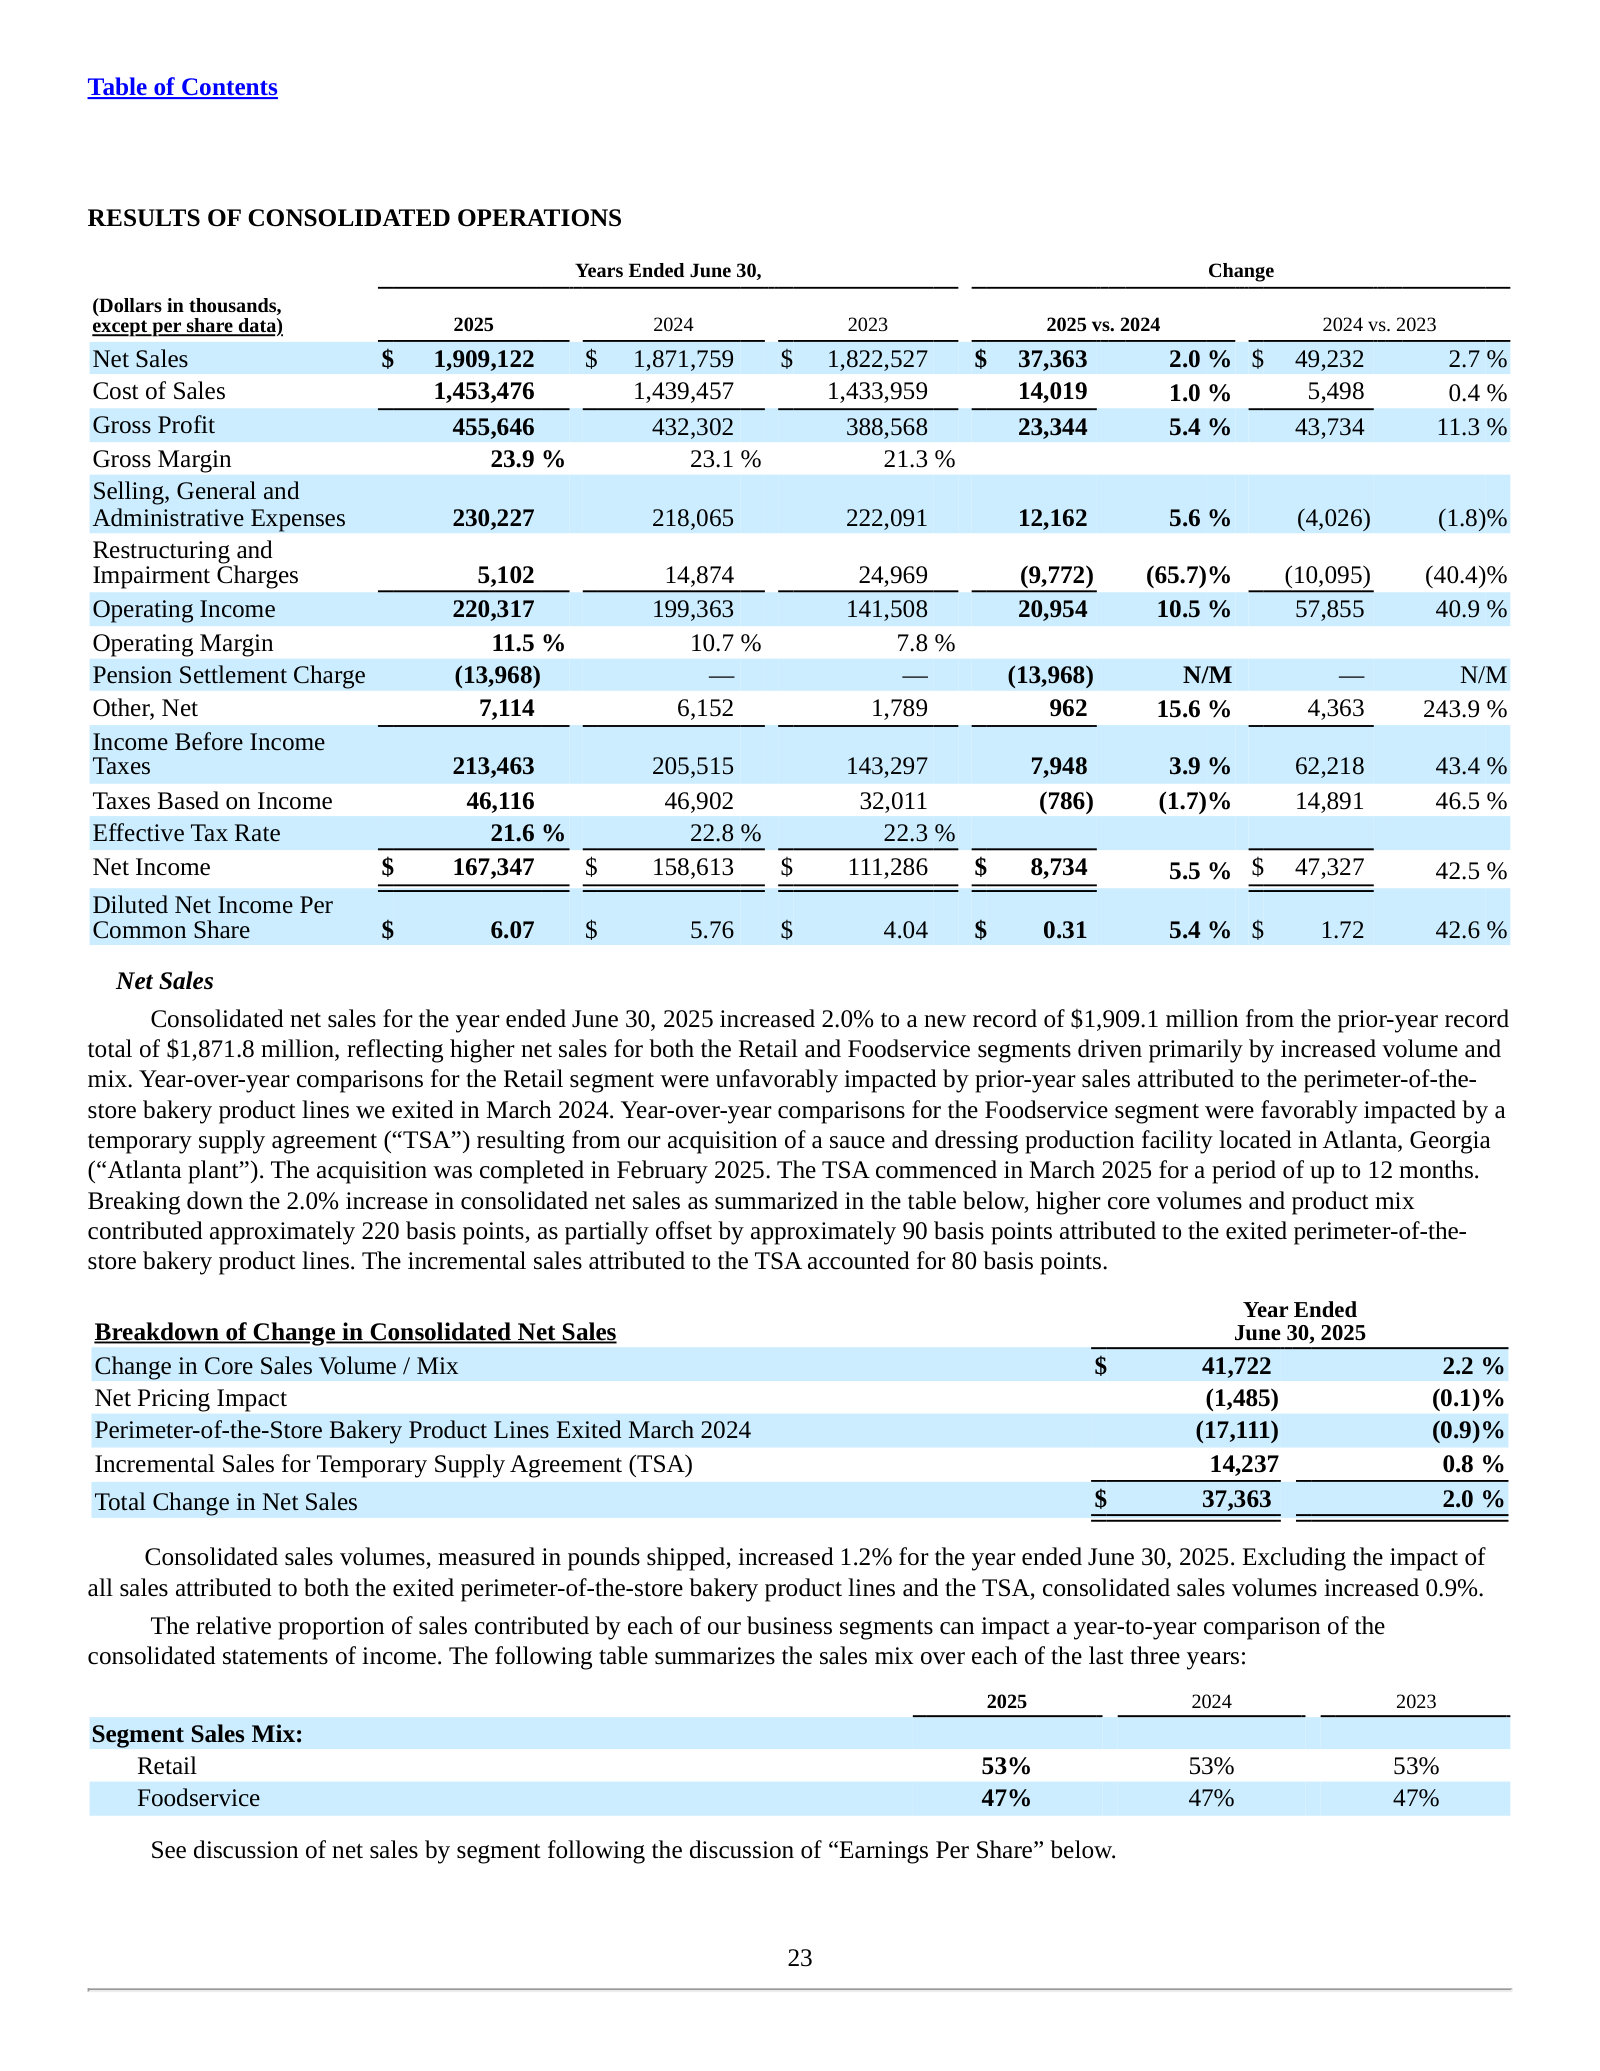
What actually moved sales, with the one-off TSA contribution separated out.
Breaking down the 2.0% increase in consolidated net sales as summarized in the table below, higher core volumes and product mix contributed approximately 220 basis points, as partially offset by approximately 90 basis points attributed to the exited perimeter-of-the store bakery product lines. The incremental sales attributed to the TSA accounted for 80 basis points. […] Consolidated sales volumes, measured in pounds shipped, increased 1.2% for the year ended June 30, 2025. Excluding the impact of all sales attributed to both the exited perimeter-of-the-store bakery product lines and the TSA, consolidated sales volumes increased 0.9%.
p. 29 · Read in context →
Results of Operations - Segments — p. 31 · Read the full section →
Segment-level drivers, including the disclosure that Foodservice volumes fell excluding the temporary supply agreement.
Retail: record sales, with the exited bakery lines distorting the comparison.
In 2025, net sales for the Retail segment reached a record $1,003.4 million, a 1.5% increase from the prior-year total of $988.4 million, reflecting higher sales volumes. Year-over-year comparisons for the Retail segment were unfavorably impacted by prioryear sales attributed to the perimeter-of-the-store bakery product lines we exited in March 2024. Excluding the exited product lines, Retail net sales increased 3.3%. […] Retail segment sales volumes, measured in pounds shipped, increased 1.6%. Excluding the impact of all sales attributed to the exited perimeter-of-the-store bakery product lines, Retail sales volumes increased 2.9%.
p. 31 · Read in context →
Foodservice: menu shifts at two chain accounts, and underlying volumes down 0.3%.
In the back half of the fiscal year, Foodservice segment net sales were unfavorably impacted by menu changes implemented by two of our national chain restaurant customers as they shifted their focus to value offerings. Excluding all sales attributed to the TSA resulting from the February 2025 Atlanta plant acquisition, Foodservice segment net sales increased 0.9%. Foodservice segment sales volumes, measured in pounds shipped, increased 0.9%. Excluding all TSA sales, Foodservice segment sales volumes declined 0.3%. […] In 2025, Foodservice segment operating income increased 14.9% to $111.6 million driven by the beneficial impact of our cost savings programs and cost deflation, as partially offset by higher supply chain costs.
p. 32 · Read in context →
Looking Forward — p. 32 · Read the full section →
Management's own FY2026 setup: modest input inflation to be offset by contractual pricing, and no material tariff impact expected.
FY2026 cost and tariff expectations as stated by management.
With respect to our input costs, in aggregate we anticipate a modest level of inflation in fiscal 2026 that we plan to offset through contractual pricing and our cost savings programs as we remain focused on continued margin improvement in the year ahead. […] While the current tariff environment entails some uncertainty, based on our understanding of currently available information for existing and proposed tariffs, we do not anticipate the performance of our business will be materially impacted by tariffs.
p. 32 · Read in context →
Impact of Inflation — p. 34 · Read the full section →
Explains why Foodservice margins swing more than Retail's — the clearest statement of how cost pass-through actually works here.
Contractual pass-through in Foodservice and the resulting margin volatility versus Retail.
With regard to the impact of commodity and freight costs on Foodservice segment operating income, most of our supply contracts with national chain restaurant accounts incorporate pricing adjustments to account for changes in ingredient and freight costs. […] As a result, the reported operating margins of the Foodservice segment are subject to increased volatility during periods of rapidly rising or falling ingredient and/or freight costs because at least some portion of the change in ingredient and/or freight costs is reflected in the segment’s results prior to the impact of any associated change in pricing. In addition, the Foodservice segment has an inherently higher degree of margin volatility from changes in ingredient costs when compared to the Retail segment due to its overall lower margin profile and higher ratio of ingredient pounds to net sales.
p. 34 · Read in context →
Lancaster Colony Corporation — FY2024 Annual Report (Form 10-K) — FY2024
Included for one section: the FY2024 MD&A is where management explains the portfolio reset that the FY2025 report only references. · Open the full document →
Restructuring and Impairment Charges — p. 30 · Read the full section →
The rationale for exiting the perimeter-of-the-store bakery lines — no scale, no direct-to-store distribution — is stated only here.
Why the Flatout and Angelic Bakehouse acquisitions were unwound.
In 2024, we committed to a plan to exit our perimeter-of-the-store bakery product lines and close our Flatout flatbread facility in Saline, Michigan and our Angelic Bakehouse sprouted grain bakery facility in Cudahy, Wisconsin. Due to a lack of scale and direct-to-store distribution capabilities for these products, we were not able to achieve the desired operational or financial performance. Production at these facilities ceased in March 2024, and we completed the divestiture of the real estate and manufacturing equipment at these locations during the quarter ended June 30, 2024.
p. 30 · Read in context →
More annual reports
Lancaster Colony Corporation — FY2023 Annual Report (Form 10-K) — FY2023 · 84 pages · The margin trough: 21.3% gross margin and the peak year of Project Ascent ERP spending, with the first Flatout impairment. · Open →
Lancaster Colony Corporation — FY2022 Annual Report (Form 10-K) — FY2022 · 78 pages · The inflation shock year, and the last report before the SAP S/4HANA go-live distorted quarterly sales comparisons. · Open →
Lancaster Colony Corporation — FY2021 Annual Report (Form 10-K) — FY2021 · 80 pages · Pre-inflation, pre-ERP baseline, with the acquired bakery brands still presented as part of the growth plan. · Open →
Competitors describe The Marzetti Company's market in their own filings and calls. These verified passages and visual pages show where their strategies meet, using source documents preserved in Sources.
The Clorox Company (Hidden Valley) (CLX)
The closest head-to-head collision with Marzetti's largest business. Clorox's Food segment is Hidden Valley — dressings, dips, seasonings and sauces — the ranch-anchored shelf and refrigerated dressing set where the Marzetti brand competes for the same shelf, the same promotional dollars and the same consumer. Featured on the Food/Hidden Valley discussion only; Clorox's cleaning, litter, Glad and Burt's Bees businesses are out of scope. Management sizes the salad dressing category, describes the promotional environment inside it, and walks through price-pack and better-for-you innovation moves that map onto Marzetti's own.
Clorox's sizing of the salad dressing category it shares with Marzetti — low single-digit declines with considerable variability — and its stated price-pack response of pushing both larger and smaller Hidden Valley sizes.
Linda Rendle, Chair and CEO — Q&A with Andrea Teixeira (JPMorgan): One area we are closely watching is food. Generally, the overall food category has faced challenges, particularly in the segment we participate in, such as salad dressing, which has experienced low single-digit declines and considerable variability. We've adjusted our strategy accordingly, and you may have noticed in our comments that both large and small package sizes in this business are performing well. This is an example of how we plan to utilize price pack architecture to meet consumer needs, offering a Hidden Valley option that provides the best value per ounce or a more affordable small size for those needing pantry staples for upcoming meals.
p. 2 · Read in context →
Clorox's account of a dressings category running weaker than it planned — a mid-single-digit rather than low single-digit decline, with what it characterises as high promotional intensity and deep discounting by competitors — alongside the pack-size reversal and reformulated launches it credits for its own share inflection.
Linda Rendle, Chair and CEO — Q&A with Peter Grom (UBS): And then the other area I would just call out would be Food. And although we did grow share in the quarter, and we saw portions of the elements of the things we put in place working, the category was weaker than we had expected. So we expected a low single-digit decline. It was closer to a mid-single-digit decline in the category. We're seeing high promotional intensity and deep discounting from competitors in that category, which is putting pressure on dollars. And we're also seeing some consumer trends that we're watching closely on GLP-1s, et cetera. […] But the good news for Hidden Valley is we did some price pack architecture work. I think you all recall, we had made a transition where we flipped our bottle upside down, which was consumer preferred right before last February when kind of value superiority really accelerated from a consumer perspective. So we have since reversed that decision and put our regular 16-ounce bottle that everyone knows and loves back on the shelf. That's playing well. In addition, we've just recently launched a number of trend forward Hidden Valley launches, including protein forward options, Avocado Oil item, and we believe that's why we've seen that inflection in share
p. 2 · Read in context →
Clorox's stated back-half plan for Hidden Valley: price-pack architecture plus an avocado-oil ranch aimed at seed-oil-avoiding consumers — the same better-for-you reformulation ground Marzetti's dressings innovation occupies. (Transcript reads 'nonseed oi'.)
Linda Rendle, CEO — Q&A with Peter Grom (UBS): in other businesses, I would call out Hidden Valley as another where price pack architecture will play a big role in the back half of the year. We think consumers trading up to larger and smaller sizes. So we're addressing that in the back half, as well as a new avocado ranch, which addresses people who are looking for nonseed oi dressings and food items.
p. 3 · Read in context →
McCormick & Company (MKC)
Competes with Marzetti on both sides of its business. In retail, McCormick calls itself one of the brand leaders in U.S. condiments and sauces (French's, Frank's RedHot, Cholula) — the adjacent set to dressings and dips. In foodservice, its Flavor Solutions segment sells customised sauces and flavour systems to restaurant chains and food manufacturers, which is the model Marzetti's foodservice segment runs. Its pending combination with Unilever's Foods business would add Hellmann's mayonnaise and dressings and create a roughly $6bn B2B foodservice platform.
McCormick's own claim to leadership in the U.S. condiments and sauces category adjacent to Marzetti's dressings and dips, and its description of the competitive set as a mix of large manufacturers and small privately-owned suppliers.
FY2025 Form 10-K — Item 1, Business: Consumer Segment: Approximately two-thirds of our Consumer segment sales are spices and seasonings and condiments and sauces. Within the spices and seasoning category, we are the brand leader globally and a category leader in our key markets. In the condiments and sauces category, we are one of the brand leaders globally and in the U.S. There are numerous competitive brands of spices and seasonings and condiments and sauces in the U.S., as well as additional brands in internationa markets. Some are owned by large food manufacturers, while others are supplied by small privately-owned companies. In this competitive environment, we are leading with innovation and brand marketing, applying our analytical tools to help customers optimize the profitability of their sales of these categories, while simultaneously working to increase our own sales and profit.
p. 3 · Read in context →
McCormick's stated scale claim for the foodservice platform it would create by combining with Unilever's Foods business — roughly $6bn of pro forma annual sales — and its front-of-house/back-of-house framing of the channel Marzetti's foodservice segment sells into. (Transcript reads 'globa' and 'back-ofhouse'.)
Brendan Foley, Chairman, President and CEO — prepared remarks on the Unilever Foods transaction: In addition to retail expansion, Slide 13 highlights the power of our combined Food Service platform. Together, we will strengthen the scale business-to-business leader with approximately $6 billion in pro forma annual sales, positioning us among the largest globa food service players. Unilever's Food Solutions brings global presence with deep back-ofhouse capabilities and culinary expertise that meaningfully expands McCormick's reach across multiple food service operators. Complementing that strength, McCormick offers a powerful branded front-of-house presence and an extensive partnership network, particularly across independent non-commercial and chain operators.
p. 3 · Read in context →
McCormick's read on where foodservice demand is still growing — QSR in the Americas, fast casual and non-commercial — against overall pressure on the channel, the same restaurant-traffic exposure that drives Marzetti's foodservice volumes.
Brendan Foley, Chairman, President and CEO — Q&A with Alexia Howard (Bernstein): Yeah, I think that specific about branded food service in your question, the segments in which we're seeing sort of more growth than the total food service industry would be, we're seeing some growth in QSRs, especially in the Americas, and we're seeing growth in fast casual dining. Also, I think one of non-commercial. Those four to five areas is where we are seeing right now, I think, most of the growth in traffic, et cetera. That's the area in which I think we're also finding that our brands certainly can play and resonate or our ability to sort of help with flavor will help there, too. I think overall, though, there certainly has been pressure on the food service marketplace. This element of, especially in the second quarter, just increased pressure on the consumer certainly coming through, not necessarily just food, but many other things that household budgets need. I think that did have an impact on food service to some degree because it did decelerate in the quarter from the first quarter, in our view. There was still growth, and the growth is happening in areas where we have been putting some focus.
p. 13 · Read in context →
Flowers Foods (FLO)
The second-largest U.S. baker and the peer that publishes the clearest picture of the bakery market Marzetti's frozen breads and dinner rolls sit inside. Flowers sizes the U.S. fresh and frozen bakery market, publishes named dollar shares for itself, Bimbo, Pepperidge Farm and private label, ships its own frozen bread and roll products through outside freezer facilities, and supplies breads and rolls to national and regional restaurants and foodservice distributors — the same two channels Marzetti serves.
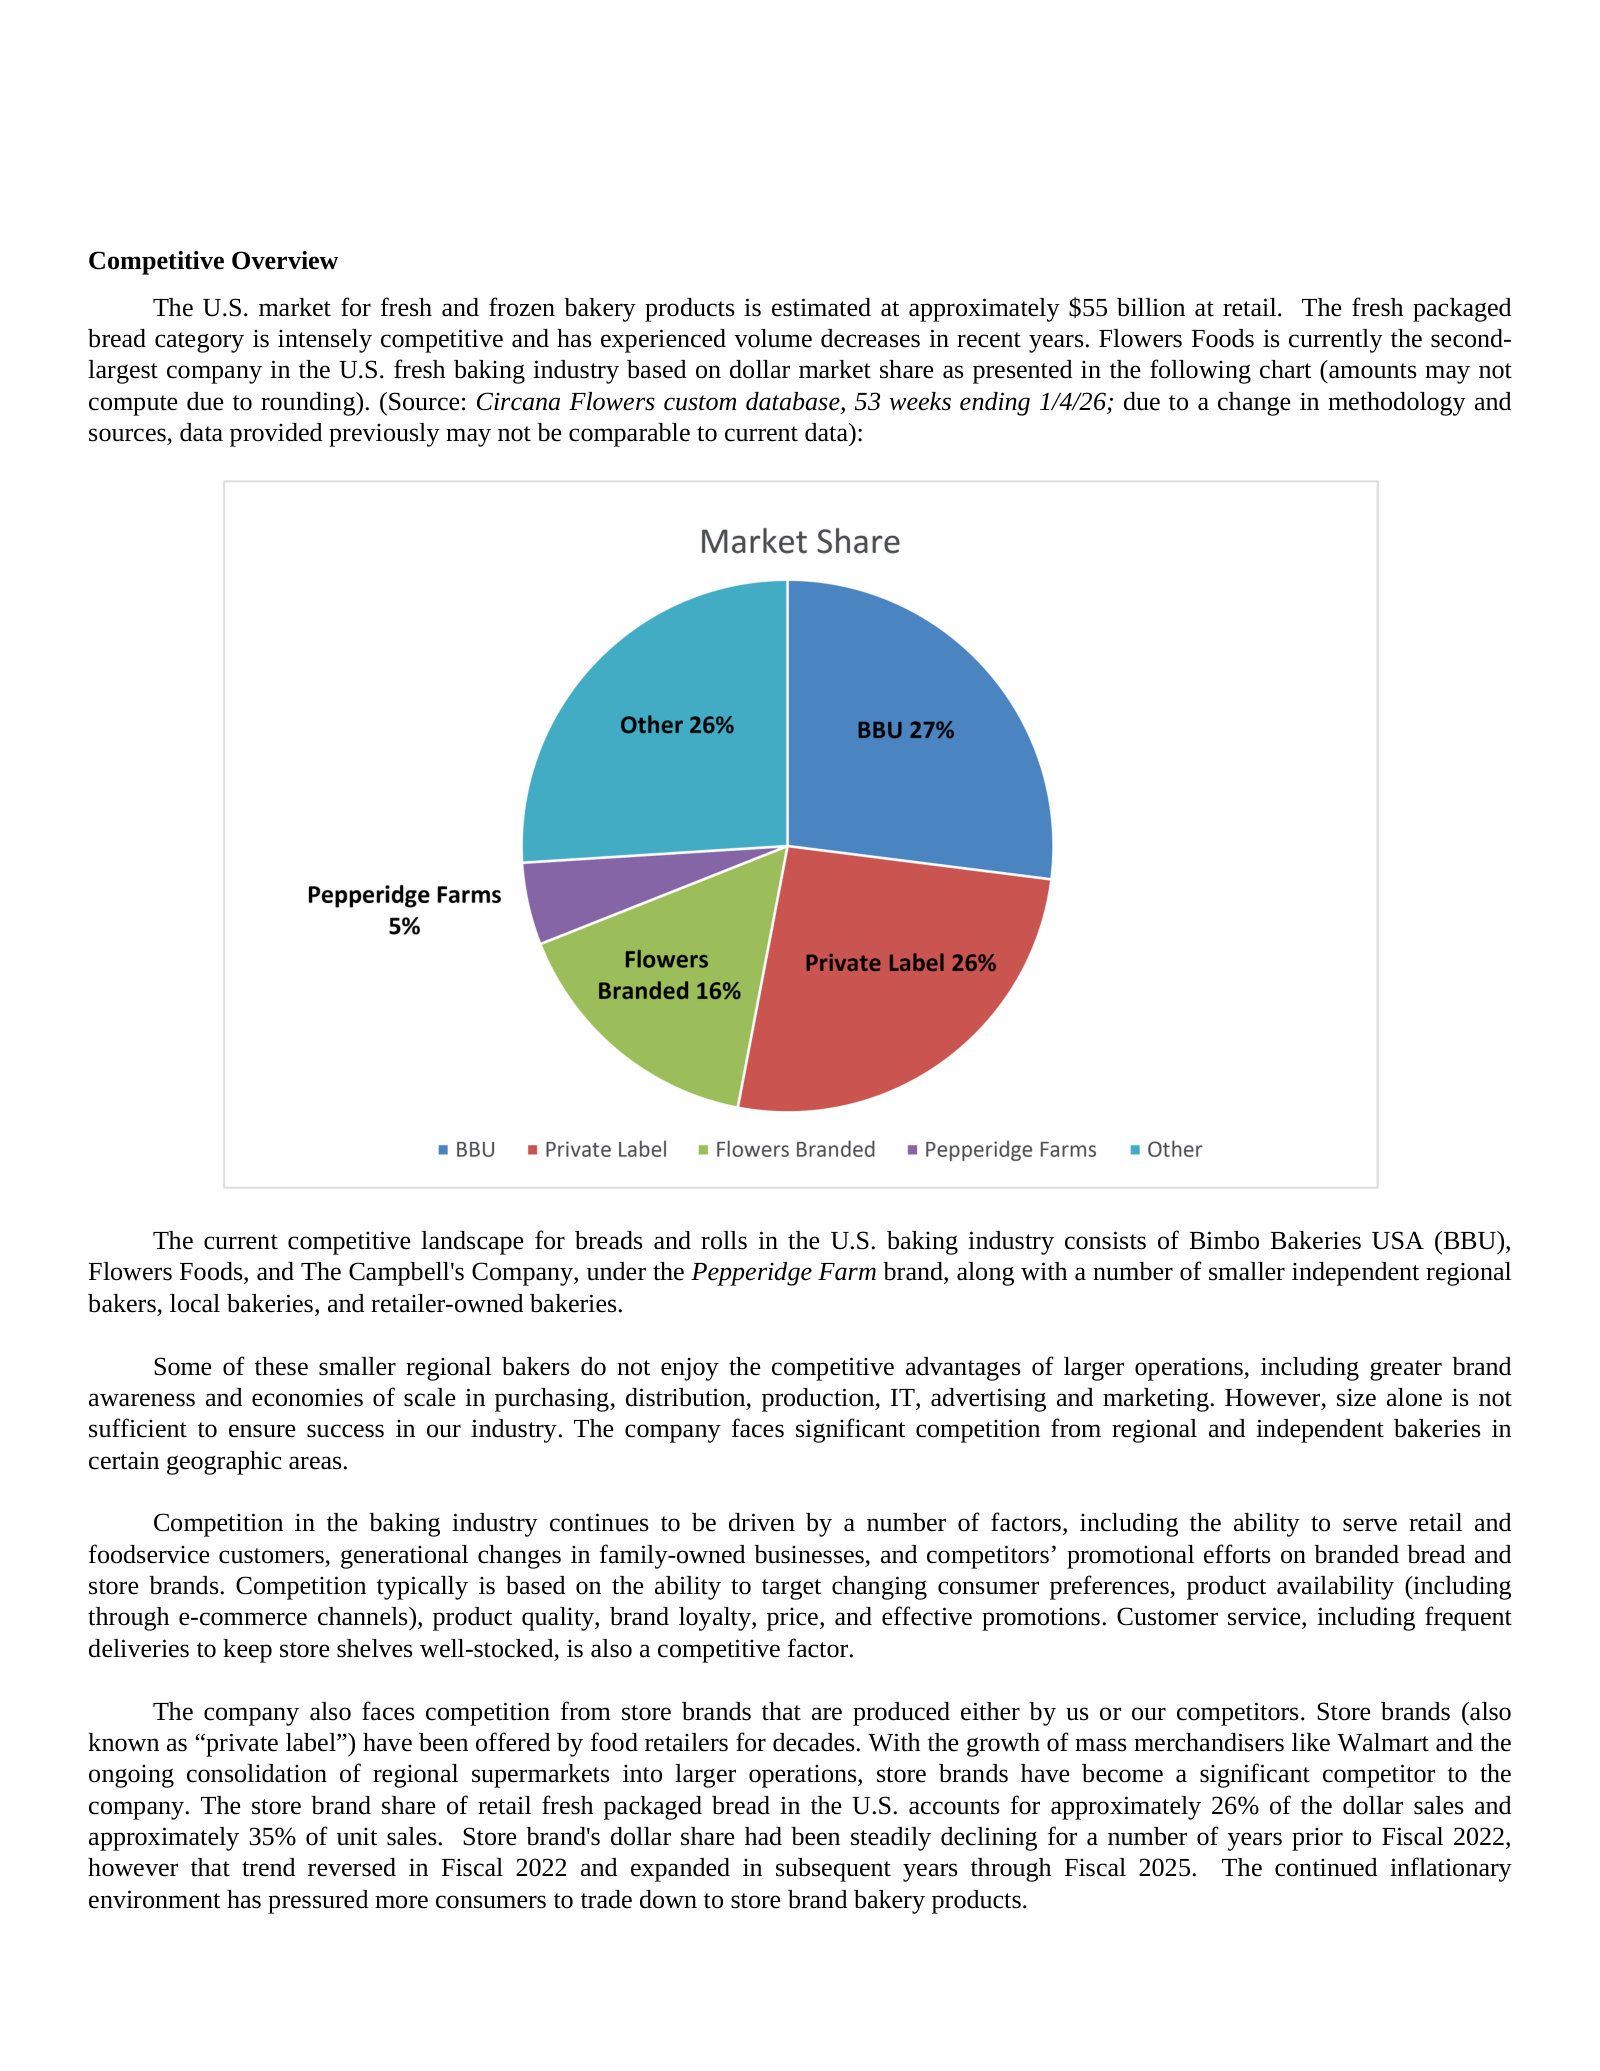
Flowers' description of its restaurant, institutional and foodservice bread-and-roll business, and its acknowledgement that it co-packs for retail customers and for food companies that are themselves competitors — the same blurred supplier/rival line that runs through Marzetti's foodservice and licensing model.
FY2026 Form 10-K — Item 1, Business: Customers: We also (1) supply national and regional restaurants, institutions and foodservice distributors, and retail in-store bakeries with breads and rolls; (2) sell packaged bakery products to wholesale distributors for ultimate sale to a wide variety of food outlets; and (3) sell packaged snack cakes primarily to customers who distribute them nationwide through multiple channels of distribution, including mass merchandisers, supermarkets, vending outlets and convenience stores. In certain circumstances, we enter into co-packing arrangements with retail customers or other food companies, some of which are competitors.
p. 15 · Read in context →
Flowers' account of foodservice weakness tracking restaurant traffic across broadline distribution and QSR, and its observation that private label had gone soft because price gaps to lower-priced branded products narrowed — a read on the trade-down dynamic that also bears on Marzetti's retail brands. The elisions drop an unrelated vending aside and the analyst's interposed follow-up question.
Ryals McMullian, Chairman and CEO — Q&A with James Salera (Stephens): Yes. Jim, the foodservice business has been under pressure, not surprisingly, given the economic environment and consumer sentiment. So that's really all that is. I would continue to note, though, that despite that weakness, the work that we've done over the last 2 to 3 years to improve the profitability of that business is still delivering very nicely on the bottom line. So that's good to see. But we would expect that to recover as the economy recovers. It tends to ebb and flow with that. […] Private label is interesting because it has been weak. You can see that in the syndicated data, which may seem kind of strange given where we are economically. But the price gaps between private label and some of the lower-priced branded products have narrowed significantly. […] Yes. You can look at traffic, which would be a good indicator. And remember, our foodservice business is really broad, right? So it's broad line through the big distributors, but it's also QSR, which has clearly been under pressure. We compete across all those channels. So it's just general weakness across foodservice given the economic environment.
p. 3 · Read in context →
Conagra Brands (CAG)
Overlaps Marzetti in frozen retail and in the custom foodservice manufacturing business, and it runs the same licensed-restaurant-brand playbook. Conagra's Foodservice segment sells customised sauces and custom-manufactured culinary products to restaurants; its Refrigerated & Frozen segment competes for the same freezer set; and it markets retail products under licences from P.F. Chang's and Wendy's, the mirror image of Marzetti's Olive Garden, Chick-fil-A, Buffalo Wild Wings, Arby's, Subway and Texas Roadhouse licences. Featured on those parts; Conagra's snacks and international businesses are out of scope.
Conagra's disclosure of the restaurant and celebrity trademark licences it sells retail product under — the same borrowed-equity model Marzetti runs, and a reminder that these arrangements are negotiated and renewable rather than owned.
FY2026 Form 10-K — Item 1, Business: Trademarks and Intellectual Property: Some of our products are sold under licensing arrangements with others, including our licensing arrangement with Dolly Parton and our licenses of the P.F. Chang’s<sup>®</sup>, Bertolli<sup>®</sup>, Wendy’s<sup>®</sup>, and Libby’s<sup>®</sup> trademarks. […] While many of these licensing arrangements are perpetual in nature, others must be periodically renegotiated or renewed pursuant to their terms.
p. 6 · Read in context →
How Conagra defines its Foodservice segment — customised sauces and custom-manufactured culinary products packaged for restaurants — which is the same custom-manufacturing-for-chains business Marzetti's Foodservice segment runs.
FY2026 Form 10-K — Item 1, Business: Reporting Segments: The Foodservice reporting segment includes branded and customized food products, including meals, entrees, sauces, and a variety of custom-manufactured culinary products packaged for sale to restaurants and other foodservice establishments primarily in the United States.
p. 5 · Read in context →
Conagra's stated approach to the frozen aisle heading into fiscal 2027 — inflation-justified pricing alongside continued brand investment, with guidance assuming higher-than-historical elasticities and mid-single-digit volume declines weighted to frozen.
John Brase, CEO — Q&A with Peter Galbo (Bank of America): Yes. Thanks, Peter. I think over the past couple of years, as you are well aware, we have invested significantly to drive volume improvement and that has yielded solid results, but it has also resulted in significant margin compression. I would tell you as inflation persisted in 2027, we just have to remain agile as we look to offset continued cost pressure. Our first line of defense will always be to use productivity to fight inflation. We are targeting another year of productivity above 4%, but we are also going to have to lean on inflationjustified pricing where necessary, just to give us the fuel that we need to invest in our business and with customers to drive that long-term growth. I would say this is all about balance—ensuring we are priced competitively and also passing along inflation-justified prices where we need to, to give us the ability to drive our brands in the categories that we compete in. I want to make sure you hear something importantly, though: we are not backing off our commitment to frozen. We are making significant incremental investments in brand building, like I just talked about, in fiscal 2027, and we have probably our strongest innovation pipeline in place to delight the consumer. And I think as you think about elasticity we have been very prudent in our elasticity assumptions. Our guidance is assumed higher than historical elasticities with volumes down mid single digits, really weighted towards frozen. So I think we have taken a prudent approach to how we plan the year.
p. 2 · Read in context →
The Kraft Heinz Company (KHC)
Groups condiments, sauces, dressings and spreads into a single 'Taste Elevation' platform — the category Marzetti's retail dressings sit in — and sells through both grocery retail and foodservice distributors, restaurants and institutions. Its away-from-home business, anchored on Heinz, is a direct competitor for the restaurant-chain sauce and dressing volume that Marzetti's foodservice segment supplies. Featured on Taste Elevation and away-from-home; Kraft Heinz's coffee, cheese and meats platforms are out of scope.
Kraft Heinz's own portfolio taxonomy, which places dressings alongside condiments, sauces and spreads in one 'Taste Elevation' platform, and its channel list spanning grocery, foodservice distributors, restaurants and institutions — both of Marzetti's channels in one company.
FY2025 Form 10-K — Item 1, Business: Sales and Customers: Our products are sold through our own sales organizations and through independent brokers, agents, and distributors to chain, wholesale, cooperative, and independent grocery accounts; convenience, value, and club stores; pharmacies and drug stores; mass merchants; foodservice distributors; and institutions, including hotels, restaurants, bakeries, hospitals, health care facilities, and government agencies. […] As of December 27, 2025, we manage our sales portfolio through eight consumer-driven product platforms. A platform is a lens created for the portfolio based on a grouping of consumer needs and includes the following for Kraft Heinz: Taste Elevation, Easy Ready Meals, Substantial Snacking, Desserts, Hydration, Cheese, Coffee and Meats. Taste Elevation includes condiments, sauces, dressings, and spreads.
p. 11 · Read in context →
Kraft Heinz's stated view of the away-from-home channel — under macro pressure but treated as a strategic share-gain target, with an explicit intent to extend Heinz beyond ketchup into mayonnaise and other spreads.
Steve Cahillane, Chief Executive Officer — Q&A with Scott Marks (Jefferies): Yes, Scott. From a macro perspective, away from home is under a fair amount of pressure based on the macroeconomic environment both in this country and around the world. Having said that, we see tremendous opportunities for us in away from home based on the strength of our brands and the opportunities in front of us, and this is one of the areas we are investing in. We see away from home as a strategic outlet and a strategic opportunity for us. We like the momentum that we are building early this year. We see a lot of opportunities both in this country and especially around the world to continue to gain share in away from home. We have one of the greatest away-from-home brands in Heinz, and we can do a lot more in leaning into Heinz—and not just in ketchup. Heinz has been successful in mayonnaise and other spreads as well. There are big opportunities for us to continue to leverage our brands, especially Heinz, as we think about the away-from-home opportunity.
p. 7 · Read in context →
The Campbell's Company (Pepperidge Farm) (CPB)
Named by Flowers Foods as the third player in the U.S. bread and roll competitive set through Pepperidge Farm, whose bakery range — including Farmhouse buns and rolls — competes with Marzetti's Sister Schubert's and New York Bakery lines. Campbell's Meals & Beverages commentary also frames the at-home cooking and premium-sauce trend that underpins Marzetti's licensed restaurant-brand retail products. Featured on the bakery and Meals & Beverages discussion; its salty snacks and soup businesses are out of scope.
Campbell's read on the bakery category — under pressure overall, with consumers being selective and favouring premium differentiated products — and its claim that its own premium innovation is outpacing segment trends.
Mick Beekhuizen, President and CEO — prepared remarks: Within our fresh bakery business, dollar and volume share were both relatively flat. However, the overall category remained under pressure as consumers are more selective in their purchases of fresh bread, favoring premium differentiated products. Our latest innovation in farmhouse thin sliced is outpacing sandwich segment trends, delivering strong repeat rates reflecting consumer demand for healthy products without compromising on taste.
p. 3 · Read in context →
More peer documents
CLX_annual_report_FY2025 — 60 pages · Clorox's 10-K describes Hidden Valley dressings, dips, seasonings and sauces inside its Food segment and claims over 80% of company sales come from No. 1 or No. 2 share brands; the segment note gives Food's sales and margin separately. · Open →
FLO_annual_report_FY2024 — 194 pages · Prior-year Flowers 10-K with the same Competitive Overview section, for a two-year read on how the bakery market size, the named share split and private-label penetration have moved. · Open →
Q4_FY2025 — 12 pages · Campbell's full-year call covers Pepperidge Farm fresh bakery share, Farmhouse buns and rolls momentum, and the premiumisation-plus-value framing across its bakery portfolio. · Open →
Source: S&P Capital IQ consensus via Xpressfeed · Generated 2026-07-29.
FY27 revenue up 2.1% over 90 days while FY27 EPS is cut 1.4% and FY28 EPS 3.3%
Both fiscal years show the same split, with revenue drifting up and EPS drifting down. The EPS cuts landed between the 90-day and 30-day marks; over the last 30 days all four lines are essentially unchanged.
Currency: USD · Scale: money in millions, absolute · Point-in-time consensus; Δ90d is Now versus 90d.
| Metric | FY | 180d | 90d | 30d | Now | Δ90d |
|---|---|---|---|---|---|---|
| EPS (normalized) | FY2027 | $7.40 | $7.32 | $7.22 | $7.22 | -1.4% |
| EPS (normalized) | FY2028 | $7.65 | $7.65 | $7.40 | $7.40 | -3.3% |
| Revenue | FY2027 | $1.99bn | $1.98bn | $2.02bn | $2.02bn | +2.1% |
| Revenue | FY2028 | $2.02bn | $2.02bn | $2.05bn | $2.05bn | +1.7% |
Normalized EPS has missed consensus in six of the last eight quarters
Current sequences by metric: Revenue: 2 consecutive misses; EPS (normalized): 2 consecutive misses.
Currency: USD · Scale: money in millions, absolute · Consensus is captured before each actual first became effective.
| Quarter | Metric | Consensus | Actual | Surprise | Outcome |
|---|---|---|---|---|---|
| Q3 FY2026 | Revenue | $464.03m | $453.37m | -2.3% | Miss |
| Q3 FY2026 | EPS (normalized) | $1.57 | $1.33 | -15.1% | Miss |
| Q2 FY2026 | Revenue | $520.37m | $517.95m | -0.5% | Miss |
| Q2 FY2026 | EPS (normalized) | $2.23 | $2.20 | -1.1% | Miss |
| Q1 FY2026 | Revenue | $474.17m | $493.47m | +4.1% | Beat |
| Q1 FY2026 | EPS (normalized) | $1.70 | $1.74 | +2.6% | Beat |
| Q4 FY2025 | Revenue | $457.98m | $475.43m | +3.8% | Beat |
| Q4 FY2025 | EPS (normalized) | $1.33 | $1.34 | +0.4% | Beat |
| Q3 FY2025 | Revenue | $483.90m | $457.84m | -5.4% | Miss |
| Q3 FY2025 | EPS (normalized) | $1.58 | $1.49 | -5.6% | Miss |
| Q2 FY2025 | Revenue | $495.43m | $509.30m | +2.8% | Beat |
| Q2 FY2025 | EPS (normalized) | $1.94 | $1.78 | -8.2% | Miss |
| Q1 FY2025 | Revenue | $468.41m | $466.56m | -0.4% | Miss |
| Q1 FY2025 | EPS (normalized) | $1.67 | $1.62 | -2.7% | Miss |
| Q4 FY2024 | Revenue | $462.27m | $452.82m | -2.0% | Miss |
| Q4 FY2024 | EPS (normalized) | $1.38 | $1.35 | -2.3% | Miss |
Consensus still carries gross margin to 25.4% by FY28 and normalized EPS to $7.40
FY26 normalized EPS of $6.75 sits barely above the $6.72 FY25 actual, so the earnings growth in this tape is concentrated in FY27, where EPS steps to $7.22. The FY28 column rests on one or two estimates per line.
Currency: USD · Scale: money in millions, absolute · YoY uses the prior fiscal year from the feed; analyst count and range use the first displayed period.
| Metric | FY2025A | FY2026E | FY2027E | FY2028E | YoY | Analysts | Low / high |
|---|---|---|---|---|---|---|---|
| Revenue | $1.89bn | $1.93bn | $2.02bn | $2.05bn | — | 5 | $1.88bn / $1.90bn |
| Gross margin | 23.9% | 24.7% | 25.3% | 25.4% | — | — | — |
| EBITDA | $288.82m | $303.94m | $329.34m | $331.90m | — | 5 | $284.60m / $292.10m |
| EPS (normalized) | $6.71 | $6.75 | $7.22 | $7.40 | — | 5 | $6.66 / $6.80 |
FY27 EBITDA spans 314.2-347.5 across five analysts; revenue spans 1,971-2,050.8 across six
Disagreement is concentrated in profitability rather than sales, with the EBITDA range proportionally wider than revenue's. FY27 normalized EPS still spans 7.10 to 7.35.
Currency: USD · Scale: money in millions, absolute · Spread/mean is absolute high-low divided by absolute mean.
| Metric | Period | Mean | Low–high | Spread/mean | Analysts |
|---|---|---|---|---|---|
| EBITDA | FY2027E | $329.34m | $314.20m–$347.50m | 10.1% | 5 |
| Revenue | FY2027E | $2.02bn | $1.97bn–$2.05bn | 4.0% | 6 |
| EPS (normalized) | FY2027E | $7.22 | $7.10–$7.35 | 3.5% | 5 |
FY28 is one broker's model rather than a consensus
FY28 normalized EPS, EBITDA and GAAP net income each rest on one estimate, so their zero dispersion is an artefact of coverage, not agreement; revenue has two. Quarterly coverage also thins to three or four analysts across the FY27 quarters.
Visible Alpha broker models via S&P Xpressfeed · 5 brokers · 301 line items · freshest revision 2026-07-13.
Retail drives sales growth of about 6% in FY-2027, up from about 2% in FY-2026
Retail is modeled up about 10% in FY-2027 against roughly 2% for Food service, widening its lead as the larger segment. Within Retail the step-up concentrates in shelf-stable dressings, sauces and croutons; frozen bread contributes, and refrigerated dressings adds little. In Food service, dressings and sauces carries what little growth there is.
| Line | FY-2025A | FY-2026A | FY-2027E | FY-2028E | YoY | Brokers |
|---|---|---|---|---|---|---|
| Total | — | — | — | — | — | — |
| Net sales | $1.89bn | $1.92bn | $2.04bn | $2.09bn | +6.2% | 5 |
| By segment | — | — | — | — | — | — |
| Net sales - Retail | $1.00bn | $1.01bn | $1.11bn | $1.14bn | +9.9% | 5 |
| Net sales - Food service | $890.08m | $915.12m | $929.11m | $947.13m | +1.5% | 5 |
| Retail mix | — | — | — | — | — | — |
| Net sales - Retail - Shelf-stable dressings, sauces and croutons | — | $415.95m | $460.80m | $536.34m | +10.8% | 3 |
| Net sales - Retail - Frozen bread | — | $402.93m | $422.74m | $414.53m | +4.9% | 3 |
| Net sales - Retail - Refrigerated dressings, dips and other | — | $190.13m | $196.94m | $193.96m | +3.6% | 3 |
| Food service mix | — | — | — | — | — | — |
| Net sales - Food service - Dressing and sauces | — | $679.33m | $697.20m | $708.71m | +2.6% | 3 |
| Net sales - Food service - Frozen breads and other | — | $229.67m | $231.17m | $238.43m | +0.7% | 3 |
Where broker models disagree
Brokers cluster tightly on total FY-2027 sales yet split materially on this single Retail line. Food service operating income and free cash flow carry the next-widest spreads, each resting on three brokers.
| Line | Period | Median | Q1–Q3 | Min–max | Brokers |
|---|---|---|---|---|---|
| Net sales - Retail - Shelf-stable dressings, sauces and croutons | FY-2027E | $450.07m | $430.84m–$485.40m | $411.61m–$520.73m | 3 |
| Operating income/(loss) - Food service | FY-2027E | $110.24m | $108.04m–$115.43m | $105.83m–$120.63m | 3 |
| Net sales - Retail - Frozen bread | FY-2027E | $425.01m | $416.80m–$429.82m | $408.60m–$434.63m | 3 |
| Free cash flow (FCF) | FY-2027E | $199.83m | $195.95m–$214.49m | $192.07m–$229.15m | 3 |
Gross margin is modeled higher in every FY-2027 quarter, and brokers barely differ
The broker spread on quarterly gross margin runs to a few tenths of a point, so the margin path is not where positions differ. The two segment margin rows rest on two to three brokers each and read as a sketch rather than a consensus.
| Line | 1QFY-2026A | 2QFY-2026A | 3QFY-2026A | 4QFY-2026A | 1QFY-2027E | 2QFY-2027E | 3QFY-2027E | 4QFY-2027E | Brokers |
|---|---|---|---|---|---|---|---|---|---|
| Consolidated | — | — | — | — | — | — | — | — | — |
| Gross margin(%) | 24.2% | 26.5% | 23.8% | 23.5% | 25.0% | 27.5% | 24.2% | 24.0% | 5 |
| Operating margin(%) | 12.4% | 14.9% | 11.7% | 10.5% | 12.6% | 15.3% | 11.8% | 11.4% | 5 |
| EBITDA margin(%) | 15.6% | 18.0% | 15.2% | 14.1% | 16.1% | 18.7% | 15.7% | 15.1% | 5 |
| By segment | — | — | — | — | — | — | — | — | — |
| Operating margin - Retail(%) | 22.0% | 22.3% | 19.2% | 20.9% | 21.1% | 22.8% | 19.8% | 20.2% | 3 |
| Operating margin - Food service(%) | 12.7% | 13.4% | 12.6% | 9.2% | 12.5% | 12.8% | 12.1% | 12.2% | 3 |
Bachan's is one broker's line: $15M in FY-2026 stepping to $100M in FY-2027
One broker breaks Bachan's out inside Retail at $15M in FY-2026, stepping to $100M in FY-2027; no other model in this set carries the line, so it is one analyst's view rather than a consensus. A second single-broker line puts Winland Foods TSA revenue in Food service at $20.4M in FY-2026 and nothing after that.
Thin coverage: five brokers at most, one on FY-2028
Five brokers is the maximum on any line here; the FY-2027 segment and product rows rest on three, quarterly product splits on two, and the whole FY-2028 column on one. Most forward rows were last revised on 2026-05-06, though a minority were refreshed on 2026-07-13, close to the 2026-07-17 consensus update. Product-level detail does not exist before FY-2026, so there is no history to anchor the mix.
Headline P&L consensus, momentum and beat/miss live in the CapIQ tab.
Source: S&P Capital IQ transcripts via Xpressfeed · latest indexed call 2026-05-04 · generated 2026-07-29.
Latest call digest
The Marzetti Company, Q3 2026 Earnings Call, May 04, 2026 · 2026-05-04T14:00:00
Q3 fiscal 2026 call — May 04, 2026. Prepared remarks led with Bachan's, the Japanese-American barbecue sauce brand acquired for $400 million and closed on May 1, funded by a $200 million term loan and cash, and with record third quarter gross profit of $107.2 million on a 50 basis point gross margin gain — the 11th straight quarter of year-over-year gross margin improvement. The reported numbers underneath were softer. Consolidated net sales fell 1% to $453 million, Retail segment net sales declined 3.2% with pounds shipped down 5.6%, SG&A rose 9.5%, and diluted EPS fell $0.14 to $1.35.
Q&A spent most of its time on that gap. Management attributed the Retail volume decline to January and February weather in the Northeast, category softness in produce and portable dressings of about 5 points, and lapping the prior-year pipeline builds for Chick-fil-A sauces in club and Texas Roadhouse rolls. Two channel problems surfaced only under questioning: the Chick-fil-A club two-pack sold consumers roughly a year's worth of supply, so buyers did not come back, prompting a three-pack; and some Costco regions moved Olive Garden dressing from full-time to rotation distribution. The earlier Easter that had been flagged in February was worth about 30 basis points to Retail, which the CFO said was slightly less than anticipated. Texas Roadhouse rolls still sell strongly at Walmart, but broader retail velocities lag because the shipping case is not display-ready — a merchandising problem rather than a demand problem, per management.
Guidance actually stated on the call: a Bachan's net sales run rate moderately above the $87 million the business reported in calendar year 2025 for 2/3 of the fiscal fourth quarter, at an operating margin similar to Marzetti's current total level; a fourth quarter tax rate of 23%; full year fiscal 2026 capital expenditures of $80 million; and a modest, inflation-level SG&A increase in the fourth quarter even with Bachan's included. Both executives described the Bachan's figure as conservative. Input-cost language hardened relative to prior calls: inflation is expected to tick up, soybean oil coverage was described as intermediate-term running through the end of summer, and the macroeconomic impact of the Iran war was named as a watch item.
Participant coverage from the latest call.
| Group | Participants | Count |
|---|---|---|
| Management | Operator; Dale Ganobsik — Vice President of Corporate Finance, Investor Relations & Treasurer, The Marzetti Company; David Ciesinski — President, CEO & Director, The Marzetti Company; Thomas K. Pigott — VP, Assistant Secretary & CFO, The Marzetti Company | 4 |
| Analysts | James Salera — Analyst, Stephens Inc., Research Division; Alton Stump — Managing Director, Loop Capital Markets LLC, Research Division; Todd Brooks — Equity Research Analyst, The Benchmark Company, LLC, Research Division; Scott Marks — Equity Analyst, Jefferies LLC, Research Division | 4 |
Curated latest-call exchanges; one row per analyst topic.
| Analyst | Firm | Topic | What changed in Q&A |
|---|---|---|---|
| James Salera | Stephens | Soybean oil coverage and fiscal 2027 procurement | Asked how long the hedge coverage runs and what the run-up does to mix and margin planning. Management described intermediate-term coverage through the end of summer on board and basis, said retail pricing plans are being built now, noted private label pricing has already started to move, and framed the position as stronger than in 2022. |
| Alton Stump | Loop Capital Markets | Retail volume decline against strong scanner data | Pressed on why segment sales fell while sell-through looked good. Management cited Northeast weather in January and February, category softness in produce and portable dressings, and lapping the Chick-fil-A club and Texas Roadhouse pipeline builds, and conceded Roadhouse velocities in general retail are lagging. |
| Todd Brooks | The Benchmark Company | Club channel friction | Asked what caused the club weakness and whether new Olive Garden items were the trigger. Management said no: the Chick-fil-A two-pack sold consumers about a year's worth of supply so buyers did not reorder, and separately some Costco regions shifted Olive Garden dressing to rotation distribution. Pack-size changes are the response, not the cause. |
| Alton Stump | Loop Capital Markets | Whether the Bachan's sales guide is deliberately conservative | Noted the gap between the guided run rate and the reported growth in the brand's scanner data. The CEO stayed bullish but would not promise linearity given new item launches in the queue; the CFO said the figure put out was probably a little conservative. |
| Todd Brooks | The Benchmark Company | Easter shift quantification | Asked for the size of the earlier Easter so the next quarter can be modeled. The CFO put the Retail benefit at about 30 basis points, slightly less than the company had anticipated when it guided in the prior quarter. |
| Todd Brooks | The Benchmark Company | Texas Roadhouse rolls: distribution versus flavor extension | Asked whether retail distribution must be fixed before line extensions. Management explained the shift from a 10-count displayable case to a 20-count non-display case hurt shelf presentation outside Walmart, said display work has been under way for several months, and said extension plans are already in place. |
| Scott Marks | Jefferies | Foodservice puts and takes | Asked for detail on national accounts. Management called the industry flat, said national accounts are 75% of Foodservice and grew led by Chick-fil-A and Taco Bell, and said the branded piece was flattish after exiting a low-margin breadstick business. |
| Scott Marks | Jefferies | IT and personnel spending inside the SG&A increase | Asked where the incremental investment is going and what it should return. The CFO said the post-SAP legacy system replacements are largely behind the company and guided to a modest, inflation-level SG&A increase in the fourth quarter even with Bachan's in the base. |
| Scott Marks | Jefferies | Which margin the Bachan's comparison refers to | A clarifying question that produced new detail: the comparison is to total operating margin, Bachan's operating margins sit slightly below the existing Retail segment because of brand-building spend, and the business is accretive at the gross margin level. |
| James Salera | Stephens | Sizing the protein dressing and dip launch | Asked how the protein launch scales. Management sized the produce dressing category at about $525 million with roughly $150 million of it theirs, and the dips category at about $200 million with a share above 75%, and said the portable dip cup is performing best so far. |
Theme tracker
Themes are curator-classified across supplied calls.
| Theme | Status | Quarters mentioned | Read-through |
|---|---|---|---|
| Restaurant brand licensing as the primary Retail growth engine | persisted | Q4 2023, Q1 2024, Q2 2024, Q3 2024, Q4 2024, Q1 2025, Q2 2025, Q3 2025, Q4 2025, Q1 2026, Q2 2026, Q3 2026 | Present in every call in the supplied history, with the cast rotating from Olive Garden and Chick-fil-A to Subway and Texas Roadhouse. The latest calls show the platform maturing rather than compounding: the Texas Roadhouse roll is now a merchandising and distribution execution story, and the Chick-fil-A club launch became a comp headwind once the pipeline build lapped. |
| Owned-brand M&A under the 'authentic flavors' label | emerged | Q2 2026, Q3 2026 | M&A had been discussed abstractly for several years as capability-building and screening. Bachan's converted it into an actual deal and, on the latest call, into a stated intention to buy more brands in the same lane. This is the newest and least-tested element of the growth plan. |
| Manufacturing network reset: Atlanta in, Milpitas out | persisted | Q2 2025, Q3 2025, Q4 2025, Q1 2026, Q2 2026, Q3 2026 | Announced, closed, restructured and then converted into a cost-savings pillar across six consecutive calls, alongside the temporary supply agreement with the seller that management repeatedly asked analysts to exclude from models. It is the most legible source of the sustained gross margin expansion. |
| Commodity pass-through, with soybean oil as the swing input | persisted | Q2 2024, Q3 2024, Q4 2024, Q2 2025, Q4 2025, Q1 2026, Q2 2026, Q3 2026 | Recurs in nearly every call but reverses direction repeatedly: deflation and favorable pricing net of commodities in fiscal 2024, a flat basket in fiscal 2025, then renewable-diesel-driven soybean oil pressure returning. The Foodservice book marks to market quarterly; Retail is where the coverage and pricing lag matters. |
| Project Ascent and ERP-related noise | dropped | Q4 2023, Q1 2024, Q2 2024, Q3 2024, Q4 2024 | A named P&L line and a recurring analyst topic through fiscal 2024, then absent from the supplied calls from Q1 2025 onward. The Q3 2026 discussion of IT spending concerns replacing legacy systems left over after SAP, not the project itself. The disappearance is the intended outcome rather than a warning sign. |
| Trade spending, promotion and private-label defence | dropped | Q1 2024, Q2 2024, Q3 2024, Q4 2024, Q1 2025, Q2 2025, Q3 2025 | For seven consecutive calls analysts probed elasticities, promoted price points and private-label gaps, and management explained why it would not lean into trade. The topic is absent from the four most recent calls, displaced by questions about marketing investment. Worth watching: the underlying category softness that drove those questions has not gone away. |
| Step-up in Retail marketing and brand investment | emerged | Q4 2025, Q1 2026, Q2 2026, Q3 2026 | Beginning with the new Retail marketing leadership, higher marketing spend has been the stated driver of Retail SG&A growth in each of the last four calls and has repeatedly been the reason segment profitability came in below where analysts expected. Management frames it as household penetration buying, not defence. |
Guidance ledger
Quotes, calls, and speakers are source-verified; outcomes are curator-classified.
| Verbatim guidance | Call | Speaker | Curator outcome | Outcome note |
|---|---|---|---|---|
| “for retail, we have low single-digit revenue growth for the second half” | The Marzetti Company, Q2 2026 Earnings Call, Feb 03, 2026 · 2026-02-03T15:00:00 | Thomas K. Pigott | missed | The CFO also said to model the second half fairly even by quarter. Retail segment net sales declined 3.2% in the following quarter. |
| “we're overall projecting low single-digit volume growth for both segments throughout the year” | Lancaster Colony Corporation, Q4 2024 Earnings Call, Aug 22, 2024 · 2024-08-22T14:00:00 | Thomas K. Pigott | missed | Foodservice fell short: segment net sales declined 3.2% in Q3 2025 and sales volume declined 1.7% in Q4 2025. Full year fiscal 2025 net sales grew 2%, primarily driven by volume. |
| “For fiscal '25, we're forecasting total capital expenditures of between $70 million and $80 million.” | Lancaster Colony Corporation, Q1 2025 Earnings Call, Oct 31, 2024 · 2024-10-31T14:00:00 | Thomas K. Pigott | missed | The forecast was cut to $65 million on the Q3 2025 call, and the Q4 2025 call reported full year payments for property additions of $58 million. The $78.8 million Atlanta facility purchase was reported separately. |
| “we expect to be able to grow our margins in the second half at similar levels of the first half, maybe in the 50 to 100 basis point range” | Lancaster Colony Corporation, Q2 2025 Earnings Call, Feb 04, 2025 · 2025-02-04T15:00:00 | Thomas K. Pigott | kept | Gross margin expanded 90 basis points in Q3 2025 and 70 basis points in Q4 2025, both inside the stated range. |
| “on the gross profit, we expect to continue to grow our margins probably in the – around the 50 basis point range” | The Marzetti Company, Q4 2025 Earnings Call, Aug 21, 2025 · 2025-08-21T14:00:00 | Thomas K. Pigott | pending | Through three quarters of fiscal 2026, reported gross margin was up 40 basis points and adjusted gross margin up 80 basis points. The fiscal year was not complete as of the latest call. |
| “Which gets us overall to low single digit on the top line, mid-single digit on the bottom line, sort of a continuation of our outlook for this year.” | The Marzetti Company, Q4 2025 Earnings Call, Aug 21, 2025 · 2025-08-21T14:00:00 | David Ciesinski | pending | Through three quarters of fiscal 2026, reported net sales rose 2.2% and adjusted net sales 0.9%, with reported operating income flat and adjusted operating income up 1%. The bottom line is tracking below the stated ambition with one quarter left. |
| “we would guide to a net sales run rate moderately above the $87 million that the business reported in calendar year 2025 with an operating margin similar to Marzetti's current level” | The Marzetti Company, Q3 2026 Earnings Call, May 04, 2026 · 2026-05-04T14:00:00 | David Ciesinski | pending | Applies to 2/3 of the fiscal fourth quarter following the May 1 close. No post-close results were available on this call, and both executives called the figure conservative. |
| “For the full year of fiscal '26, we are forecasting total capital expenditures of $80 million.” | The Marzetti Company, Q3 2026 Earnings Call, May 04, 2026 · 2026-05-04T14:00:00 | Thomas K. Pigott | pending | Narrows the $75 million to $85 million range given earlier in fiscal 2026. Year-to-date payments for property additions were $54.6 million. |
Q&A pressure map
Question counts and firms are curator tallies; analyst coverage shown above.
| Topic | Questions | Firms | Pressure / response |
|---|---|---|---|
| Bachan's economics, integration and durability of its growth | 8 | The Benchmark Company, Loop Capital Markets, D.A. Davidson, Stephens, Jefferies | Every covering firm engaged on the deal across the Q2 2026 announcement call and the Q3 2026 close call, working through margin structure, co-packing and synergy timing, foodservice potential, and why the company is ready to integrate a brand now. One answer did not land: asked for the brand's fourth quarter calendar 2025 exit run rate, management responded with brand attributes, cohort skew and the calendar year base, without addressing the exit rate. |
| Foodservice demand and national account volume | 6 | Stephens, Jefferies | The most persistent topic outside the deal, asked on every call in the window. Analysts keep testing whether the company's outperformance is a customer-mix effect that can reverse; management consistently answers with the same structure — flat industry, winners and losers, chicken and sauces as the hedge. |
| Retail volume softness and shipment timing | 5 | Jefferies, Stephens, Loop Capital Markets, The Benchmark Company | Government shutdown effects, the Easter pull-forward, club channel resets and quarterly cadence. Analysts have been trying to separate genuine category weakness from calendar and pipeline noise for two consecutive calls, and the answers have leaned heavily on the second explanation. |
| Retail segment profitability and the marketing and SG&A step-up | 5 | The Benchmark Company, Jefferies | Recurring pushback on segment profit coming in below expectations. Management's answer has been consistent — deliberate marketing investment plus timing of cost savings favouring Foodservice — and it has now been given enough times that the burden is shifting to showing the payback. |
| Commodity costs and pass-through mechanics | 3 | Stephens, Loop Capital Markets | Focused on soybean oil, renewable diesel policy and the lag between Foodservice quarterly mark-to-market and Retail list pricing. The questions have grown more pointed as the input has swung from tailwind to watch item. |
| Licensing platform durability | 3 | Loop Capital Markets, The Benchmark Company | Whether Chick-fil-A club expansion and Texas Roadhouse rolls can keep compounding, and whether flavor extensions come before or after distribution is fixed. Answers have moved from headline velocity numbers toward execution detail on shelf presentation. |
Language shifts
Only language evidence verified against the referenced component is shown.
| Observation | Verbatim evidence | Call ID | Component |
|---|---|---|---|
| Input-cost language hardened on the latest call. Where the two prior calls described a modest level of inflation to be offset by contractual pricing and cost savings, the Q3 2026 remarks describe inflation continuing to rise and name a geopolitical watch item that had not appeared in any earlier call in this history. | “we anticipate that inflation will continue to tick up during the months ahead, and we will continue to carefully monitor the macroeconomic impact of the Iran war” | 1996123128 | 4 |
| The prior-quarter baseline for that shift. The same section of the Q2 2026 script paired a modest inflation outlook with a stated commitment to continued margin improvement; the margin-improvement pledge is absent from the equivalent Q3 2026 passage. | “we anticipate a modest level of cost inflation that we plan to offset through contractual pricing and our cost savings program” | 1979169054 | 4 |
| Soybean oil moved from a neutral line item to a defended position. On the Q4 2025 call the CFO called it neither a headwind nor a tailwind; on the latest call the CEO frames it relative to a prior price spike and points analysts at Retail coverage as the thing to watch. That is reassurance framed against a bad precedent rather than an absence of concern. | “we feel like we're in a much better position as it pertains to that than we were in 2022, the last time we saw a spike” | 1996123128 | 7 |
| Retail volume confidence was stated explicitly in February and is not restated in May. The Q2 2026 answer committed to a volume growth rate for the business; the Q3 2026 call reports a Retail volume decline and offers no replacement volume framing for the segment. | “we continue to believe that we're set up to deliver low single-digit volume growth against this business here” | 1979169054 | 7 |
| The same consumer-trend vocabulary changed polarity. In Q1 2026 GLPs and MAHA appeared in a list of forces making organic growth difficult; in Q3 2026 the same terms are used to argue consumers will keep buying flavor. The evidence is the reframing itself, not a change in the underlying facts management cites. | “In the era of MAHA and GLP-1 we believe consumers will continue to seek flavor enhancements for their meals.” | 1996123128 | 2 |
| New strategic vocabulary appears in the closing remarks. 'Authentic flavors' is introduced as a named third growth leg alongside legacy brands and restaurant licensing, and is explicitly tied to further acquisitions rather than to this one deal. | “the first of what we believe will be more acquisitions in an area that we're calling authentic flavors” | 1996123128 | 34 |
The call history supports the margin case and complicates the volume case: gross margin has improved for an 11th straight quarter on network and productivity work that is well documented across the last six calls, while the Retail volume growth committed to in February did not survive the next quarter. Bachan's is now the swing variable, and management has so far guided it deliberately low and disclosed little beyond the calendar year 2025 base.
Bottom line
The Marzetti Company sells salad dressings, sauces and frozen breads to US grocers and restaurant chains: $1.91 billion of FY2025 net sales, split near-evenly between branded Retail and private-label Foodservice, funded with no debt and 63 straight years of dividend increases. Earnings are at a record. The multiple is not — roughly 17x trailing earnings against a decade spent in the high-20s and above. This chapter establishes what the business is and what repriced.
A 60-year-old company with a new name
Lancaster Colony Corporation renamed itself The Marzetti Company on 27 June 2025 [1], and the ticker moved from LANC to MZTI on the Nasdaq Global Select Market [2] [3]. The renaming did not change what the company sells. The Ohio company has been food-only since it sold its last non-food businesses in 2014 [4], and it has raised its regular cash dividend every year for 63 years, most recently to $1.00 a quarter paid on 31 December 2025 [5].
Over 95% of what it sells is sold in the United States, out of 14 domestic food plants, and it owns no fixed assets outside the country [6] [7]. There is no currency exposure to disentangle and no international growth story to underwrite.
FY2025 Net Sales ($M)
FY2025 Operating Margin
FY2025 Return on Equity
Years of Dividend Increases
Sources: FY2025 Form 10-K, Consolidated Statements of Income and Statements of Shareholders' Equity [8]; dividend streak per the Q2 FY2026 earnings release [9]; return on equity derived from reported net income and year-end shareholders' equity.
Two segments running through one plant network
Retail — $1,003 million of FY2025 net sales — is the branded half. It sells Marzetti refrigerated and shelf-stable dressings and dips, New York Bakery frozen garlic bread, Sister Schubert's frozen dinner rolls, plus Cardini's and Girard's shelf-stable dressings and Chatham Village croutons. Alongside those owned brands it sells a portfolio of products made under exclusive licences from restaurant chains: Chick-fil-A sauces and dressings, Olive Garden dressings, Buffalo Wild Wings sauces, Texas Roadhouse steak sauces and frozen rolls, and Subway sauces [10]. The top five Retail customers took 62% of the segment's sales in FY2025, up from 59% in each of the two prior years [11].
Foodservice — $906 million — is mostly the opposite: custom-formulated sauces, dressings and frozen breads sold under private label to national chain restaurant accounts, largely through distributors. National accounts were $694 million of the segment in FY2025; branded and other foodservice was $198 million [12]. The top five direct Foodservice customers were 53% of segment sales [13].
Source: FY2025 Form 10-K, Note 9 Business Segment Information [14]; FY2021 and FY2022 from the FY2022 Form 10-K segment note [15].
The two segments earn very differently. Retail produced $211.7 million of segment operating income in FY2025 — a 21.1% margin — against Foodservice's $111.6 million on a 12.3% margin [16]. Segment operating income totalled $323.3 million; unallocated corporate expenses of $97.9 million and $5.1 million of restructuring charges reduced that to the reported $220.3 million [17]. Corporate overhead is real money here — 5.1% of net sales, roughly a third of what the two segments earn before it.
Both segments run through the same plants [18], and both depend on the same set of restaurant relationships. The two segments therefore share a cost base and a customer list.
Where the growth came from
One relationship has supplied most of the incremental sales. Total net sales attributed to Chick-fil-A — Foodservice supply to the chain plus the retail licence for its sauces and dressings — went from 14% of consolidated net sales in FY2019 to 29% in FY2025 [19] [20] [21]. Walmart, the largest single retailer, barely moved over the same span: 18% in each year from FY2020 to FY2024, 19% in FY2025 [22] [23] [24] [25].
Sources: FY2021, FY2023, FY2024 and FY2025 Forms 10-K, Net Sales Attributed to Significant Customer Relationships [26] [27] [28] [29].
The mechanism is worth stating precisely, because it is the company's distinctive asset. Marzetti manufactures for a restaurant chain, and that manufacturing relationship gives it the credibility and the recipe to license the chain's brand into the grocery aisle. The FY2025 10-K describes it as leveraging strong Foodservice customer relationships to establish exclusive licensing agreements for the retail channel [30]. It worked with Chick-fil-A sauces from a 2020 pilot to national distribution in April 2021, and it has since been repeated with Buffalo Wild Wings, Subway and Texas Roadhouse [31] [32].
Applying the disclosed percentages to reported net sales sizes the engine. Chick-fil-A-attributed sales were roughly $213 million in FY2020 (16% of $1,334 million) and $548.2 million in FY2025, the figure disclosed in dollars in the revenue note [33] — about $335 million of the $575 million by which total net sales grew over those five years [34] [35] [36] [37].
The risk factors describe the terms. Foodservice sales to Chick-fil-A alone were 21% of consolidated net sales in FY2025 and FY2024, made mostly through distributors, and the company states plainly that it has no long-term purchase commitments from Chick-fil-A or those distributors [38]. The two halves of the 29% rest on different mechanics: the 21-point Foodservice supply leg carries no long-term purchase commitment, while the retail leg sits on a brand licence that runs for a fixed term with no automatic renewal and can be terminated or not renewed at the licensor's option on short notice [39].
The financial shape
Six years of the record, as reported:
Sources: FY2025 Form 10-K, Consolidated Statements of Income and Cash Flows [40] [41]; FY2020–FY2022 from the FY2022 Form 10-K [42] [43]. Operating margin derived from reported figures.
Three things stand out in that table. First, the shape of the last five years is a margin round-trip, not a straight line: operating margin fell from 13.2% in FY2020 to 6.7% in FY2022 as commodity and freight costs ran ahead of pricing and restructuring charges hit $35.2 million, then recovered to 11.5% by FY2025 [44] [45]. FY2025 diluted EPS of $6.07 is a record, but it sits only 22% above FY2020's $4.97 — a 4.1% annual rate over five years, on 7.4% annual sales growth. The gap is margin, not share count: diluted shares were 27.5 million in FY2020 and 27.5 million in FY2025 [46] [47].
Second, the earnings turn into cash. Operating cash flow was $261.5 million in FY2025 against $167.3 million of net income, and across FY2021–FY2025 cumulative operating cash flow of $1,015 million covered cumulative net income of $669 million 1.5 times [48] [49]. Depreciation of $62.2 million against capex of $58.0 million in FY2025 says the plant network is at maintenance-plus, after the $132.0 million capex peak of FY2022 [50] [51].
Third, almost all of that cash goes out as dividends. Over FY2021–FY2025 the company paid $462 million of dividends and repurchased $41 million of stock against $579 million of free cash flow after capex [52] [53]. The dividend per share went $3.35, $3.55, $3.75 across FY2023–FY2025 and is now running at $4.00 [54] [55]. Maintaining the 63-year streak has first call on the cash the business generates.
The balance sheet has been the reason the streak was never at risk. Marzetti closed FY2025 with $161 million of cash, $998 million of shareholders' equity and no debt [56], and at 31 March 2026 it held $218.4 million of cash, $1,044.8 million of equity and still no borrowings [57].
Ownership is concentrated and long-dated. John B. Gerlach, Jr., a director, beneficially owned 27.3% of the shares as of 22 September 2025 and his mother Dareth A. Gerlach 21.5% — the two overlap through the same family trusts, which hold 20.8% — with BlackRock at 9.4% and Vanguard at 7.6% [58]. All executive officers and directors as a group held 29.1%; CEO David Ciesinski held 59,011 shares, roughly 0.2% [59]. The control block belongs to the founding family, not to the operators — a distinction worth holding onto, since the two align interests in different ways.
What repriced in 2026
The stock has fallen from $173.91 on 2 February 2026 to $110.19 on 28 July 2026 — a 37% decline over six months — with the largest single-day moves on 3 February (down 7.7%), 4 May (down 6.6%) and 14 July (down 6.3%).
Source: daily closing prices as reported; July 2026 is the close of 28 July 2026.
Two things happened on 3 February 2026, the day of the first break. Marzetti reported a second quarter in which consolidated net sales rose 1.7% but, excluding $8.2 million of non-core sales under a temporary supply agreement, adjusted consolidated net sales rose 0.1% — with Retail down 1.1% [60]. And it announced an agreement to buy Bachan's, Inc., a Japanese barbecue sauce brand with roughly $87 million of net sales in the twelve months to 31 December 2025, for $400 million [61].
That is 4.6 times Bachan's sales, for a company whose own equity was then valued at roughly 2.5 times its sales. The deal closed on 1 May 2026, funded with $200 million of cash on hand and a $200 million term loan drawn on 29 April 2026 — amortising at $2.5 million a quarter, maturing April 2031, alongside a revolver increased from $150 million to $200 million [62]. A company that had carried no debt now carries $200 million of it, against $282 million of FY2025 operating income plus depreciation — well under one turn, but no longer zero.
The operating news since has not argued against the market. In the March 2026 quarter, consolidated net sales fell 1.0% to $453.4 million and diluted EPS fell 9.4% to $1.35 [63]. Retail net sales fell 3.2% with pounds shipped down 5.6% [64]; over the nine months Retail sales were down 0.4% on volumes down 2.0%, while Foodservice sales rose 5.0% and its operating income rose 19.6% [65]. Nine-month EPS of $5.21 was still 6.5% ahead of the prior year [66]. Earnings kept rising; the branded half stopped growing in volume.
The multiple moved further than the earnings did.
Source: derived from closing prices as reported and reported diluted EPS for the fiscal year then ended [67] [68]; the 2026 bar uses the 28 July 2026 close against trailing twelve-month diluted EPS of $6.39 (Q4 FY2025 through Q3 FY2026). The FY2022 and FY2023 readings are elevated by that period's depressed earnings, not by an expanding price.
Close, 28 Jul 2026
Market Cap ($M)
Trailing P/E
Dividend Yield
Source: closing price as reported; market capitalisation uses 27,422,381 shares outstanding at 31 March 2026 [69]; yield on the $1.00 quarterly rate [70].
At $110.19, the market values Marzetti's equity at about $3.02 billion, or 17.2 times trailing earnings and 1.6 times FY2025 net sales, with a 3.6% dividend yield. Consensus for FY2026, on four to six contributing analysts, is $6.75 of EPS on $1.93 billion of sales, and $7.22 on $2.02 billion for FY2027 — putting the shares on roughly 16 times this year's estimate and 15 times next year's. Both estimates have been trimmed over the last 90 days.
What the evidence supports, and what would change it
This is a genuine de-rating of a business whose economics have not yet deteriorated — gross margin, cash conversion (operating cash flow of $228.7 million on net income of $143.3 million) and Foodservice profit all improved through the nine months to March 2026 [71] [72] [73], though nine-month operating margin slipped to 12.4% from 12.7% — and it is not an unreasonable one, because the growth engine that earned the old multiple has stopped adding volume, and the company has just spent $400 million and its debt-free balance sheet building a second one.
The strongest fact against reading this as a company-specific dislocation is the group: Marzetti's packaged-food comparables de-rated a year earlier, and measured from the end of 2024 its 36% decline sits in the middle of that set. Part of what happened in 2026 is a premium-rated staple converging on its peers rather than a judgement on Marzetti alone; the peer multiple comparison is set out in Margin of Safety.
Source: peer daily closing prices as reported, calendar 2025 and year-to-date 2026.
Two observable things would move this read. If Retail pounds shipped return to growth over two or more consecutive quarters — the FY2026 10-K and the FY2027 10-Qs report this line directly — the stall looks like the government-shutdown and club-channel softness management described, and the current multiple looks like an overreaction [74] [75]. If the Chick-fil-A share of consolidated net sales — disclosed every year in Item 1 of the 10-K — falls rather than plateaus, the de-rating was early rather than wrong [76].
This report tests whether the stall in Marzetti's licensing-led growth engine — roughly 58% of net sales growth since fiscal 2020, now concentrated enough that one restaurant relationship supplies 29% of consolidated sales, its larger Foodservice leg carrying no long-term purchase commitment and its retail half resting on a fixed-term licence terminable at the licensor's option — is a pause or a plateau, and what a newly-levered balance sheet, a 63-year dividend record and a 17x trailing multiple are worth under each answer.
Figures are US dollars, the company's reporting and trading currency. The fiscal year ends 30 June. The FY2026 Form 10-K had not been filed as of 29 July 2026, so the latest audited annual data is FY2025 and the latest reported period is the quarter ended 31 March 2026. Web research was unavailable for this run, so no sell-side commentary, ownership changes after the September 2025 proxy record date, or post-quarter news beyond the company's own filings has been incorporated.
The Licensing Engine
Marzetti's largest commercial relationship is two separate businesses wearing one name: supplying Chick-fil-A's restaurants through distributors, and selling Chick-fil-A-branded sauce on grocery shelves under an exclusive licence. Together they were $548.2 million of FY2025 net sales [1]. The retail leg has carried recent growth, is roughly $147 million, and sits on a fixed-term licence the licensor can decline to renew on short notice [2].
Two legs, one counterparty
The 10-K discloses the relationship three separate ways, and the three disclosures do not measure the same thing. Item 1 gives the combined figure — 29%, 28% and 26% of consolidated net sales in FY2025, FY2024 and FY2023 [3]. A risk factor gives only the Foodservice half: sales to Chick-fil-A within the Foodservice segment, made primarily through distributors, were 21% of consolidated net sales in both FY2025 and FY2024 [4]. The revenue note gives the combined figure in dollars — $548,222 thousand, $519,818 thousand and $480,973 thousand [5].
Subtracting the second from the third isolates the retail licence. Earlier filings supply the same pair back to FY2020: the Foodservice leg was 20% and 18% of consolidated net sales in FY2023 and FY2022 [6], and 17% and 15% in FY2021 and FY2020 [7], against combined figures of 24%, 21% and 16% for FY2022, FY2021 and FY2020 [8]. The retail licence started as a regional pilot in March 2020 and reached national distribution in April 2021 [9].
Source: derived — Foodservice leg is the disclosed percentage of consolidated net sales; the retail licence is the disclosed combined total less that leg. Combined dollars are as reported for FY2023–FY2025 [10] and derived from the disclosed percentage for FY2020–FY2022 [11]; Foodservice percentages from [12], [13] and [14].
The percentages are rounded to whole numbers, so each derived leg carries roughly plus or minus $10 million of imprecision at FY2025 sales. Within that tolerance, the shape is unambiguous. The Foodservice leg tripled between FY2020 and FY2023 and has since flattened: $364.5 million, $393.1 million, $400.9 million. The retail licence went from a rounding error to $147.3 million, or about 15% of Retail segment net sales of $1,003.4 million [15].
A second disclosure in the same note confirms where FY2025's growth came from. Foodservice net sales to national accounts — the channel that contains the Chick-fil-A supply business — were $693.6 million in FY2025 against $692.3 million in FY2024, growth of 0.2% [16]. Chick-fil-A-attributed sales rose 5.5% over the same year. The arithmetic puts most of that $28.4 million increase in the retail licence, and implies the rest of the national-account book shrank by a few million dollars while Chick-fil-A held its ground.
The distributor layer moved too. McLane, a Berkshire Hathaway subsidiary, was 13% of consolidated net sales in FY2021 [17] and 11% in FY2022 and FY2023, then fell to 8% in FY2024 because "certain national chain restaurant accounts shift[ed] their purchases from McLane to other distributors or to direct purchases" [18]. By FY2025 McLane is not named in the 10-K at all. The end customer did not change; the invoicing path did.
What the licences say, and what they do not
The public record on terms is one paragraph. Brand licence agreements are "typically for a fixed term with no automatic renewal options or provisions," and "[o]ur key brand license agreements can be terminated or not renewed at the option of the licensor upon short notice to us" [19]. The FY2022 10-K said more: fixed terms "ranging from three to five years" [20]. That range was dropped from FY2023 onward and has not returned. Nothing in the filings says why, and the change may be nothing more than drafting economy. The three-to-five-year range appears in the FY2022 10-K and in no later filing. The retail licence leg crossed $100 million in that same fiscal year.
The Foodservice leg has no contract to point at either: "We do not have any long-term purchase commitments from Chick-fil-A or such distributors, and we may be unable to continue to sell our products in the same quantities or on the same terms as in the past" [21].
No licence agreement appears anywhere in the filed exhibits — the material-contracts, credit-agreement and merger exhibit files in this corpus are construction contracts, equity award forms, credit facilities and purchase agreements. An investor cannot read the terms, the royalty, the exclusivity carve-outs, or the renewal date, because they have never been filed. That is a real limit on how precisely this risk can be underwritten.
The shelf and the plant
Consumption and shipments diverged through FY2026, and the direction of the gap is the useful part.
Sources: Retail segment net sales and pounds shipped from the FY2026 Form 10-Qs [22], [23], [24]; Chick-fil-A sauce scanner growth from management's Circana commentary on the FY2026 earnings calls [25], [26], [27].
In the September 2025 quarter Retail net sales rose 3.5% and pounds shipped rose 3.2%, and management attributed part of that to Chick-fil-A sauce "we began shipping into the club channel in late fiscal 2025" [28]. Chick-fil-A sauce scanner sales grew 9.6% against a category growing 0.2% [29]. By December Retail net sales fell 1.1% and pounds fell 3.1%, against overall scan sales up 2.3% and Chick-fil-A sauce up 6.7% [30] [31]. By March the gap was widest: Retail net sales down 3.2%, pounds down 5.6%, and scanner sales of core and licensed brands up 0.2% [32] [33].
The 10-Q names the cause: gains from frozen bread were "more than offset by the impacts of category softness and reduced sales into the club channel" [34]. On the call the CEO added that the company has "initiatives in place with our club channel partners to pursue future growth for both our Chick-fil-A sauces and Olive Garden dressings" [35]. The club placements that added shipments in the first half of FY2026 were, by the third quarter, subtracting them — and the two lines named are both licensed.
That distinction matters for reading the stall. A five-point gap between pounds shipped and consumption is a distribution and inventory event, not a consumer verdict. It reverses when it laps; a demand decline does not. The licensed brands themselves kept taking share through all three quarters, and the deceleration in Chick-fil-A sauce consumption from 9.6% to 4.4% is the more durable signal: still growth, at a third of the earlier rate, on a base that is now national.
What the licensing program earns on the shelf
Marzetti's own investor deck sizes the licensed portfolio at retail. For the 52 weeks ended 29 June 2025, Circana measured Total US Multi-Outlet dollar sales for each brand.
Source: The Marzetti Company investor presentation, 2 June 2026, Appendix B — Circana, Total US Multi-Outlet, 52 weeks ended 29 June 2025 [36] [37].
The four wholly licensed lines measure $473.8 million of retail sell-through — comparable in scale to the owned brands beside them, and achieved in about five years. These are retail prices for tracked channels, not Marzetti's wholesale net sales, so they are not additive to the segment figures; the useful comparison is licensed against owned on the same basis.
Two facts in that table cut against reading the program as a single-name dependency. The licensing platform now runs across Chick-fil-A, Olive Garden, Buffalo Wild Wings, Arby's, Subway and Texas Roadhouse [38], and the newest licence is working: Texas Roadhouse rolls reached $32.9 million and 10.5% of the frozen dinner roll category in their first full year, sitting alongside Sister Schubert's at 50.6% of the same category [39] [40]. The FY2025 MD&A credits Retail growth to "our licensing program led by Texas Roadhouse dinner rolls, Chick-fil-A sauces and Subway sauces" — three licensors, not one [41].
What the relationship carries
Neither leg has a disclosed margin, so the sensitivity has to be built from segment averages. In FY2025 the Retail segment earned $211.7 million on $1,003.4 million of sales (21.1%) and Foodservice $111.6 million on $905.7 million (12.3%), with $97.9 million of unallocated corporate expense and $5.1 million of restructuring charges standing between the $323.3 million of segment operating income and the $220.3 million reported [42].
Chick-fil-A Sales, FY2025 ($M)
Share of Net Sales
Retail Licence Leg ($M)
Est. Share of Operating Income
Sources: sales as disclosed [43]; retail leg and operating-income share derived by applying FY2025 segment operating margins to each leg [44].
Applying those margins, the Foodservice leg carries roughly $49 million of segment operating income and the retail licence roughly $31 million — about $80 million, or a quarter of total segment operating income and roughly 37% of consolidated operating income after corporate costs. The estimate is coarse in both directions. Licensed retail products pay a royalty and Foodservice supply to a single large chain is competitively priced, so the true margins may run below segment average; against that, in any near-term disruption the fixed manufacturing and corporate overhead does not leave with the volume, so the earnings hit in the first year would exceed the segment-average arithmetic.
The read this supports: the concentration is real and the retail leg is the fragile half — smaller in dollars, higher in margin, and resting on a fixed-term licence with no renewal right. But the FY2026 evidence points to a distribution reset rather than a broken relationship, and the strongest fact against a bearish reading is that the Retail segment earned more on lower sales in the March quarter — operating income up 3.4% to $47.1 million on sales down 3.2%, on cost savings and pricing [45]. A business losing a licence does not look like that.
What would change the read
Three disclosures settle most of this. The FY2026 10-K will restate the combined Chick-fil-A percentage and the Foodservice-only percentage; if the combined figure falls while the Foodservice leg holds at 21%, the retail licence has stopped growing rather than paused. The June-quarter Retail volume laps the club load-in that began in late FY2025 — a return to positive pounds shipped would confirm the FY2026 decline as a channel reset. And a licence agreement filed as an exhibit, or a stated renewal date, would replace the estimates above with facts; absent that, the term and royalty of the company's largest retail licence remain unreadable from the public record.
The counterweight now sits partly outside the licensing program. Bachan's, bought for $400 million on about $87 million of trailing sales [46], is an owned brand in the same sauces category (Business and De-Rating) — the first material addition of growth that no licensor can withdraw.
The Foodservice Half
Foodservice is 47% of Marzetti's net sales and reads on the page as a second business. The segment note argues otherwise. Roughly 44% of it is Chick-fil-A, and the remainder — every other national chain plus the branded product sold through distributors — has been flat at about $490 million for three fiscal years. The segment's profit growth over that period came from cost, not from the book widening.
What the segment actually sells
The 10-K states the model in one sentence: "The majority of our Foodservice sales are products sold under private label to national chain restaurant accounts. We also manufacture and sell various branded Foodservice products to distributors" [1]. Marzetti owns no consumer brand across most of this revenue. It formulates a chain's sauce, makes it, and ships it under the chain's name.
That shows up cleanly in the segment's unit economics, which the FY2025 segment note discloses down to cost of sales and overhead for the first time.
Source: derived from the FY2025 segment note — Retail net sales $1,003.4m, cost of sales $700.3m, SG and A $91.5m; Foodservice net sales $905.7m, cost of sales $753.2m, SG and A $40.9m [2].
Foodservice earns a gross margin 13.4 points below Retail's and spends half as much on overhead to do it — 4.5% of sales against 9.1%. Half the gross-margin gap is recovered on the expense line, because a private-label manufacturer buys no shelf space and runs no advertising. What remains is an 8.8-point operating-margin gap that is structural to the model rather than a sign of poor execution.
The same relationships are where the retail licences come from. The company's Retail description says it "expanded Retail segment growth by leveraging our strong Foodservice customer relationships to establish exclusive licensing agreements for the retail channel" [3], and the June 2026 deck puts the six licensor logos above a line crediting "Our Proven Culinary Expertise and Demonstrated Sales Execution in the Retail Channel Combined with Our Strong Reputation and Longstanding Relationships in the Foodservice Channel" [4]. Foodservice is the origination channel for the licence portfolio, which is why its customer list matters more than its margin.
Chick-fil-A inside the segment
The 10-K discloses the Chick-fil-A supply relationship as a percentage of consolidated net sales, not of the segment: 21% in both FY2025 and FY2024 [5], and 20% in FY2023 against 18% in FY2022 [6]. Converting to dollars and setting them against segment sales gives the figure the filings never print: Chick-fil-A is about 44% of the Foodservice segment, up from roughly 32% in FY2020 [7] [8].
Sources: national accounts, branded and other, and temporary-supply-agreement sales as disclosed [9]; the Chick-fil-A supply leg derived from the disclosed 21%/21%/20% of consolidated net sales [10] [11] and subtracted from the national-account line.
The percentages are rounded to whole numbers, so the Chick-fil-A leg carries roughly $9 million of imprecision in either direction at current sales — the same tolerance the licence decomposition in The Licensing Engine works under. The proportion is therefore best read as 43% to 45% rather than a point estimate.
The book without Chick-fil-A
Removing the Chick-fil-A supply leg and the temporary supply agreement from the Atlanta plant purchase leaves the part of Foodservice that is every other restaurant chain and every branded case sold through a distributor. It was $492.7 million in FY2023, $490.3 million in FY2024 and $490.6 million in FY2025 — flat, while total Foodservice sales rose 5.7% and consolidated sales rose 4.8%.
Inside that, the two halves moved in opposite directions. National accounts other than Chick-fil-A fell from $312.2 million to $292.7 million, down 6.2%. Branded and other — the Marzetti, New York Bakery and Sister Schubert's product sold to distributors, where the company does own the brand — rose from $180.5 million to $197.9 million, up 9.6% [12].
The decline in the non-Chick-fil-A national-account book survives the rounding. Taking the widest reading of the disclosed percentages — a Chick-fil-A leg at the top of its band in FY2023 and the bottom in FY2025 — the residual still falls, from at most $321.3 million to at most $302.2 million. Across every combination inside the tolerance the book shrinks, by between $0.8 million and $38.2 million. The direction is a disclosed fact; only the magnitude is estimated.
Foodservice, share of net sales
Chick-fil-A, share of Foodservice
Foodservice ex-CFA, ex-TSA ($M)
Share of operating income
Sources: FY2025 segment note [13]; Chick-fil-A share derived from the disclosed 21% of consolidated net sales [14]; operating-income share after a pro-rata allocation of unallocated corporate expense, derived.
Management's own account of FY2025 fits. Foodservice sales rose 2.5%, but excluding the temporary supply agreement the increase was 0.9% and pounds shipped declined 0.3%, and the back half was "unfavorably impacted by menu changes implemented by two of our national chain restaurant customers as they shifted their focus to value offerings" [15]. The flat dollar book is not deflation concealing volume growth. Volume was slightly negative and two named accounts cut menu items.
One reading of the segment points the other way. The top five direct Foodservice customers fell from 58% of segment sales in FY2023 to 53% in FY2024 and FY2025 [16], which reads as diversification. Those top five are distributors rather than chains, as the 10-K says in the next sentence, and the fall coincides with the McLane unwind traced in The Licensing Engine, where accounts moved to other distributors or bought direct. What changed is which distributor invoices the sale, not which restaurants the food reaches.
Foodservice Margin History
The segment's profitability has moved on a different track from its sales.
Sources: FY2019–FY2021 segment table [17]; FY2022–FY2023 [18]; FY2024 [19]; FY2025 [20]; nine months to 31 March 2026 [21].
Seven fiscal years run between 10.9% and 14.0%, with no trend. The nine months to March 2026 sit at 14.0% on $98.9 million of segment operating income against $82.7 million a year earlier [22] — level with the FY2021 peak, and 14.4% once the temporary supply agreement's $20.4 million of near-zero-margin sales are stripped from the denominator [23]. That is the best reading in the disclosed record, and Margin Runway traces its source to a manufacturing network consolidation — production shifted out of the Milpitas plant into the newer College Park facility, with management attributing the resulting savings primarily to Foodservice — together with a trade-spend system benefit, rather than to pricing power. FY2025's own 14.9% rise in segment operating income is attributed by the MD&A to "our cost savings programs and cost deflation" [24]. The March 2026 quarter already gave some back, at 12.5% on $27.4 million of segment operating income [25] against 13.0% a year earlier [26].
The nearest comparable business in the peer set is McCormick's Flavor Solutions segment, which supplies custom formulations to food manufacturers and restaurant chains and describes the same proposition — relationships "active for decades", sold on "sensory testing, culinary research, food safety, and flavor application" [27]. It earned a 12.4% segment operating margin in FY2025 against 11.5% in FY2024, on volume and mix that fell 0.2% and 0.3% in those years [28]. Marzetti's Foodservice segment ran 12.3% and 11.0% on volume that also fell. The comparison is imperfect — McCormick's segment is global and sells heavily to packaged-food manufacturers as well as restaurants, at roughly three times the scale — but on the two measures that overlap, the businesses are near-identical, and the volume stall is a condition of the channel rather than something happening only to Marzetti.
What the segment contributes
The company allocates no balance sheet to its segments: "we do not prepare, and our CODM does not review, separate balance sheets or property additions for the reportable segments" [29]. Most plants make product for both segments [30]. A return on capital for Foodservice, and therefore a defensible standalone multiple, cannot be built from this disclosure — an honest limit on how far the segment can be valued apart.
What can be computed is its share of profit. Charging the $97.9 million of unallocated corporate expense pro rata by sales leaves Foodservice with about $65 million of FY2025 operating income against Retail's $160 million — 30% of the consolidated total on 47% of the sales [31]. Applying the segment margin to the $490.6 million that is neither Chick-fil-A nor the supply agreement puts the genuinely independent part of Foodservice near $35 million of operating income after the same corporate charge — about 16% of consolidated operating income. That 16% is net of a pro-rata share of unallocated corporate expense and measured against the consolidated total, whereas the roughly 25% of profit the Chick-fil-A relationship carries in The Licensing Engine is gross of corporate expense and measured against total segment operating income; the two percentages are on different bases and are not directly comparable. This one errs low if Chick-fil-A's very large private-label volume earns below the segment average, which is the usual pattern for an account of that size.
My read is that Foodservice diversifies this company less than its 47% sales weight suggests. It is the same customer relationship as the retail licence portfolio, sold twice; the part that is independent of Chick-fil-A has not grown in three years; and its recent profit gain is a network restructuring with a completed date rather than a widening book. On the moat question the evidence supports narrow, and located in the wrong place for a brand owner: custom formulation, culinary co-development and qualified capacity are real switching costs — Marzetti has held these accounts for years, and McCormick's decades-long relationships in the same channel corroborate that they stick — but they attach to a private-label contract, not to a consumer franchise Marzetti owns.
The strongest fact against that read is the branded-and-other line, which grew 9.6% over the three years to FY2025 and is the one part of Foodservice carrying Marzetti's own brands. It is now $197.9 million of owned-brand revenue inside a segment usually described as private label. Against it, that line then turned down 0.8% over the first nine months of FY2026, to $150.8 million from $152.0 million, while national accounts rose 3.2% on inflationary pricing and the supply agreement [32].
What would change the read: a national-account win large enough to move the residual book — on the order of $50 million, roughly a sixth of the non-Chick-fil-A national-account line — or the FY2026 10-K showing that residual turning up on volume rather than on pass-through pricing. The disclosure to watch is the same one used here: the national-accounts line in the segment note, set against the Chick-fil-A percentage in the risk factors. The June 2026 deck says the licensing programme has "Opportunities for Continued Growth Through Established and Potential Future Agreements Supported by Our Recent Investments in Increased Capacity" [33]. No seventh licensor has been named, and the funnel that would produce one is this segment's customer list.
Financials and Estimates
Marzetti's operating income rose 56% between fiscal 2023 and fiscal 2025, but 62% of the increase came from gross-margin expansion and 25% from restructuring charges falling away, not from selling more. The first nine months of fiscal 2026 broke that pattern: reported earnings per share rose 6.5%, while on the company's own per-share adjustments they were flat at $5.37 and operating income fell 0.2%. Consensus for fiscal 2027 assumes both re-accelerate.
The three-year record
FY2025 Net Sales ($M)
FY2025 Operating Margin
FY2025 Diluted EPS ($)
FY2025 Operating Cash Flow ($M)
Source: FY2025 Annual Report (Form 10-K), Results of Consolidated Operations [1] and Consolidated Statements of Cash Flows [2].
Across the three fiscal years the company reports in full, net sales grew from $1,822.5 million to $1,909.1 million — a compound rate of 2.4% a year — while diluted earnings per share went from $4.04 to $6.07, a compound rate of 22.6% [3]. The gap between those two rates is where the period's earnings growth came from, and it sits in two places: gross margin and restructuring charges.
Source: FY2025 Annual Report (Form 10-K), Results of Consolidated Operations [4].
Operating income rose $78.8 million over the two years. Splitting that increase into its parts: sales growth of $86.6 million, earned at the fiscal 2023 gross margin of 21.3%, is worth $18.5 million; the 260-basis-point rise in gross margin to 23.9% applied to fiscal 2025 sales is worth $48.6 million; overheads absorbed $8.1 million; and restructuring and impairment charges, which ran at $25.0 million in fiscal 2023 as the company exited its perimeter-of-the-store bakery lines, fell to $5.1 million, releasing $19.9 million [5] [6].
Source: derived from the FY2025 Annual Report (Form 10-K) three-year results table; components computed at reported margins [7].
Two-thirds of the earnings recovery, then, is a cost result, and a further quarter is the absence of charges the company was taking in the base year. Management's own adjusted measure makes the same point more gently: adjusted operating income, which strips restructuring and acquisition costs from both years, rose 5.7% in fiscal 2025 to $229.2 million against reported growth of 10.5% [8]. Fiscal 2025 also carried a $14.0 million pension settlement charge below the operating line, from terminating five frozen defined-benefit plans, which cut reported earnings per share by roughly $0.39 [9]. That charge matters more than its size suggests, because it is the reference point for how fiscal 2026 looks.
Balance sheet and cash
Sources: FY2025 Annual Report (Form 10-K) balance sheet [10] and cash flow statement [11]; FY2023 equity from the FY2024 Annual Report balance sheet [12]; FY2022 equity from the FY2023 Annual Report balance sheet [13]; returns derived from those figures.
The returns are the reason the business earns a premium multiple in the first place. With no debt on the balance sheet in any of the three years [14], return on average equity ran at 17.4% in fiscal 2025 and return on invested capital net of cash at 20.6%, against 13.0% and 14.2% in fiscal 2023 — the same margin recovery showing up in the return measure. Operating cash flow was 2.03 times net income in fiscal 2023 and 1.56 times in fiscal 2025 [15], which is what happens when a working-capital release in the base year is not repeated rather than a sign of deteriorating quality.
Capital intensity fell sharply over the period — capex of $90.2 million in fiscal 2023 against $58.0 million in fiscal 2025 [16] — and management has guided fiscal 2026 back up to approximately $80 million [17]. Free cash flow of $203.5 million in fiscal 2025 covered the $103.5 million dividend twice over, before the balance sheet changed shape (Business and De-Rating).
The first nine months of fiscal 2026
Nine-month net sales rose 2.2% to $1,464.8 million. The company's own decomposition of that increase is where the reading starts to diverge from the headline: core sales volume and mix subtracted $2.4 million, net pricing added $15.1 million, and a temporary supply agreement — a transitional arrangement to keep supplying the seller of the Atlanta plant Marzetti bought in February 2025 — added $18.4 million [18].
Source: Q3 FY2026 Form 10-Q, Breakdown of % Change in Consolidated Net Sales [19].
The temporary supply agreement is disclosed separately in the revenue note at $20.4 million of nine-month Foodservice sales against $2.1 million a year earlier, and it is already winding down — third-quarter supply-agreement sales were $1.5 million against $2.1 million [20]. Excluding it, adjusted net sales rose 0.9% and adjusted pounds shipped fell 0.6% [21].
Below the sales line, the pattern of the prior three years reversed. Gross profit rose $13.7 million and gross margin gained 40 basis points, the eleventh consecutive quarter of year-on-year gross-margin improvement on management's count [22]. Selling, general and administrative expense rose $12.1 million, or 7.2%, on higher marketing, compensation and IT spending plus $3.5 million of Bachan's acquisition costs, and a $2.0 million net restructuring and impairment charge appeared where there had been none [23]. Operating income fell $0.4 million to $181.0 million [24].
Source: Q3 FY2026 Form 10-Q, Condensed Consolidated Statements of Income [25] and Results of Consolidated Operations [26].
Reported diluted earnings per share for the nine months were $5.21 against $4.89, up 6.5% [27]. The 10-Q itemises what sat inside each figure: in fiscal 2026, Bachan's acquisition costs cut $0.10 and the net restructuring charge $0.06; in fiscal 2025, the pension settlement cut $0.39 and Atlanta plant acquisition costs $0.09 [28]. Adding each period's own disclosed items back puts both nine-month figures at $5.37. On the company's own adjustments, per-share earnings were unchanged year on year, and the entire reported increase is the prior year's charges not repeating.
The strongest fact against reading that as deterioration is that like-for-like operating income still grew: adjusted operating income rose $1.8 million to $186.6 million, or about 1% [29]. Roughly $0.08 of the flat adjusted per-share result is non-operating: the effective tax rate rose to 22.7% from 22.0%, and other non-operating income fell $1.1 million as the pre-acquisition cash pile was spent down [30] [31]. Gross margin is still expanding while overhead growth absorbs the gain, an absorption sized and bounded in Margin Runway.
Inside the business the movement was not uniform. Nine-month Retail segment operating income fell 6.0% to $160.5 million as segment margin slipped to 21.1% from 22.4%, while Foodservice rose 19.6% to $98.9 million; unallocated corporate expense rose 6.8% to $77.0 million [32]. The licensed Retail portfolio and the shipment-versus-consumption gap behind the Retail decline are traced in The Licensing Engine.
Where the cash came from
Nine-month operating cash flow rose 31.9% to $228.7 million, a figure management highlighted on the call [33]. The $55.3 million increase decomposes cleanly, and only a minority of it is earnings.
Source: derived from the Q3 FY2026 Form 10-Q, Condensed Consolidated Statements of Cash Flows [34].
The single largest item is a $24.7 million swing in deferred income taxes, which the 10-Q attributes to timing benefits from the One Big Beautiful Bill Act enacted in July 2025 — legislation that accelerated deductions for domestic research spending and bonus depreciation, with no material effect on the effective tax rate [35] [36]. Cash income tax payments fell to $24.8 million from $42.2 million [37]. That is real cash, but it is a shift in timing that unwinds as the accelerated deductions are used up, not a change in earning power. The second largest, a $27.1 million working-capital swing, is largely the absence of the prior year's receivable and inventory build. Underlying cash generation improved; it improved by considerably less than 32%.
What the forward estimates carry
Fiscal 2026 ended on 30 June 2026 and has not yet been reported — no fourth-quarter release or Form 10-K had been filed as of late July 2026 — so both the current and the following year are consensus figures rather than results.
Source: consensus estimates as at 29 July 2026, from the report's market-data feed; no filing page backs these figures.
Source: consensus estimate revision history as at 29 July 2026, from the report's market-data feed; no filing page backs these figures.
Three things are worth extracting from that table. First, the direction: the fiscal 2026 estimate has come down 3.8% in ninety days and fiscal 2027 by 1.8%, with four downward revisions recorded on each in the trailing thirty days. The ninety-day mark sits just before the 4 May third-quarter release, which reported $1.35 against a consensus that then stood at $1.57 — a 14% shortfall. The cuts followed the print rather than anticipating it.
Second, the panel is thin and internally inconsistent. Between three and six analysts contribute to any single line. The fiscal-year earnings panel implies a June-quarter result of $1.53 ($6.745 less the $5.21 already reported), while the June-quarter panel itself says $1.40 — and on revenue the fiscal-year panel implies a June quarter of $460.6 million against the quarterly panel's $476.0 million. The $15.4 million revenue gap is close to the scale of a partial-quarter Bachan's contribution, which suggests the annual revenue line has not been fully updated for a deal that closed on 1 May 2026 [38]. Either way, these are not deeply sampled numbers, and small-panel consensus should be treated as a rough marker rather than a forecast.
Third, and most consequential: both years assume a re-acceleration that the reported nine months do not yet show. Taking the more current construction — nine months actual plus the June-quarter panel — fiscal 2026 lands at about $1,940.8 million of sales and $6.61 of earnings per share. Fiscal 2027 consensus of $2,018.9 million is $78 million above that. Bachan's should supply roughly $75 million of incremental revenue in its first full year, on management's guidance to a run rate moderately above the $87 million the brand reported in calendar 2025, against a two-month stub in fiscal 2026 [39]. The temporary supply agreement, worth about $21 million in fiscal 2026, disappears. Netting those leaves roughly $20 million to $25 million, a little over 1% of the base, to come from the underlying business — against nine-month core volume and mix of minus 0.2% and adjusted pounds shipped of minus 0.6%.
The earnings step is the harder one. Fiscal 2027 consensus of $7.22 is 9.2% above the $6.61 construction, about $16.6 million of additional net income. Bachan's contributes at "an operating margin similar to The Marzetti Company's current level" on management's guidance [40] — roughly $8 million to $9 million of incremental operating income on the $75 million of net new revenue left after the two-month fiscal 2026 stub, before any amortisation of acquired intangibles, which cannot yet be estimated because the purchase price allocation will not be filed until the fiscal 2026 Form 10-K. Against it sits the financing: interest on the $200 million term loan at a rate management described as currently below 5% [41]. Underwriting Bachan's owns that arithmetic and sets the first full year at about $18 million of pre-tax cost against $10 million to $12 million of acquired operating income on the brand's full $87 million to $95 million sales base; the lower contribution figure used here is the same guided margin applied to the smaller incremental base.
On that arithmetic, the acquisition is close to earnings-neutral in its first full year, and essentially all of the 9.2% consensus growth has to come from the base business — the same base business whose nine-month operating income fell 0.2% and whose adjusted per-share earnings were flat. The credible route to it exists: the Milpitas plant closure completed in August 2025 [42] and the network optimisation behind it carry savings into fiscal 2027, the fiscal 2025 fourth quarter absorbed the full $5.1 million of that year's restructuring charges [43] and will not repeat, and Bachan's is margin-accretive at the gross line even if it is not at the operating line while the brand is being built [44]. The route requires the productivity program to outrun overhead growth, which it has not done for three quarters.
At $110.19 on 28 July 2026, the shares trade at 16.3 times the fiscal 2026 consensus and 15.3 times fiscal 2027, with a $4.00 annualised dividend representing 59% of the fiscal 2026 estimate. The estimates are the more fragile half of those ratios.
What would change the read
The June quarter is structurally the weakest of Marzetti's year: fiscal 2025's fourth quarter produced $38.9 million of operating income on $475.4 million of net sales, an 8.2% margin against 11.5% for the full year [45]. Reaching even the lower $1.40 of the two consensus constructions, against $1.18 reported in the June 2025 quarter, requires roughly $51 million of operating income against that $38.9 million reported and about $44.4 million adjusted [46] [47] [48]. About $5.1 million of that gap is the restructuring charge not repeating and a few million more the Bachan's stub; the rest has to be operational. A June quarter that clears $1.40 with overhead growth back below gross-profit growth would argue the nine-month pattern was an investment year rather than a plateau. A June quarter near $1.20, with selling and administrative expense still compounding at 7% or more, would put the fiscal 2027 consensus roughly a full year ahead of the business.
The other item to watch is disclosure rather than performance: the fiscal 2026 Form 10-K will carry the Bachan's purchase price allocation, and with it the amortisation charge that the consensus models currently cannot see. A large allocation to definite-lived intangibles would take a further bite out of reported earnings without touching cash.
Web research was unavailable for this run, so no broker-level detail behind the consensus figures, and no post-quarter commentary, could be verified beyond the market-data feed described above.
Margin Runway
Marzetti's earnings have been carried for three years by cost, not volume. The programme is real and quantified: management's stated target is roughly $20 million of cost out a year, and the delivered gross-margin gain has run at about 80 basis points annually since fiscal 2024. Two things bound it. Gross margin is still 250 basis points below where it stood in fiscal 2021, and a rising share of what the programme produces is absorbed by overhead growth before it reaches operating income: 52% across fiscal 2025 [1], 54% over the first half of fiscal 2026 [2], 88% over the nine months to March 2026, and more than all of it in the March quarter alone, where $5.4 million of overhead growth met $1.3 million of gross-profit growth [3]. The 88% is a nine-month figure rather than a run rate, and the absorption is concentrated in Retail and at the corporate centre rather than spread across the company.
What eleven quarters have recovered
The March 2026 quarter was, on management's count, the eleventh consecutive quarter of year-on-year gross-margin improvement [4]. That streak is the operating fact the rest of this report leans on — the free cash flow behind the dividend, the perpetuity arithmetic in Margin of Safety, which capitalises today's earnings as a stream that never grows, and the fiscal 2027 consensus in Financials and Estimates. What the streak has been recovering from is less often stated.
Sources: FY2021 Form 10-K, Results of Consolidated Operations [5]; FY2022 Form 10-K [6]; June 2026 investor presentation, supplemental financial information [7]; nine-month fiscal 2026 adjusted gross margin per the same deck [8].
Gross margin was 26.4% in fiscal 2021 and 26.8% in fiscal 2020 [9]. Fiscal 2022 took it down 520 basis points to 21.2%, and operating margin with it, from 12.7% to 6.7% [10]. Three years of recovery have brought reported gross margin to 23.9% in fiscal 2025 and, on the company's own measure excluding the pass-through temporary supply agreement, to 25.2% for the nine months to March 2026 [11] [12].
So the eleven quarters have retraced roughly three-quarters of a loss, not built a new peak. That distinction sets the runway. Asked in January 2024 whether the business could return to a 26% to 27% gross margin, the CEO framed it as an aspiration "to get the business to the midpoint of our peers" and attached an explicit condition: soybean oil and comparable inputs staying structurally lower, "both on the board and on basis" [13].
The two engines, and which one is still running
Management has consistently split the gross-margin gain into two parts: pricing net of commodities, which it abbreviates to PNOC, and the structural cost programme. The split has been disclosed only occasionally, but the disclosures that exist trace a clean handover.
Sources: Q2 FY2024 earnings call, prepared remarks and question and answer [14] [15]; Q3 FY2024 call [16]; Q1 FY2025 call [17]; Q3 FY2026 call [18].
The December 2023 quarter delivered 360 basis points of gross-margin expansion, and pressed on the split, the CFO put "a little over 200 basis points" of it on pricing net of commodities and "a little over 100 basis points" on cost savings [19] [20]. By the September 2024 quarter the gain was 20 basis points and the CFO said plainly that "pricing net of commodities was not a significant driver of performance" [21]. The commodity windfall that produced the large early quarters was over within four quarters of appearing. What has run since is the structural programme alone.
In the same January 2024 exchange, the CEO put the only number the corpus contains on that programme: "our target is roughly $20 million of cost out each year," sourced from procurement, logistics, manufacturing productivity and value engineering [22]. That sentence appears once. It has not been repeated, updated or reconciled to an outcome in any subsequent call, filing or deck in this corpus. The June 2026 investor presentation devotes six slides to "FY26 Supply Chain Path Forward," including a value-engineering framework and a strategic-procurement page, and contains no savings figure on any of them [23] [24]. The same slides have appeared, substantively unchanged, in every quarterly deck since November 2024.
The delivered result can be checked against the target. Consolidated gross profit rose $13.7 million in the nine months to March 2026, with reported gross margin up 40 basis points and adjusted gross margin up 80 [25]. Annualised, that is roughly $18 million of gross profit — close to the $20 million target, in a year the CFO had said would carry neither significant commodity headwind nor benefit [26]. The programme is producing what it was said to produce.
The target has never been benchmarked in the corpus, and one peer quantifies its own. Campbell's targets roughly $375 million of annual ongoing savings by the end of fiscal 2028, raised in September 2025 from the $250 million announced a year earlier [27], or about 1.3% a year of its $7.13 billion cost of products sold over the four years [28]; Marzetti's $20 million on $1.45 billion of cost of sales is about 1.4% [29]. The two are not strictly like for like — Campbell's is a bounded programme with an end date, $215 million of identified charges and a published running total, where Marzetti's is an open-ended annual run rate with none of those disclosed, and Conagra and McCormick describe their equivalents without attaching an annual figure. On pace, the target Marzetti has set itself is ordinary for the group rather than stretching.
What the margin cost to buy
The recovery did not come free. Between fiscal 2019 and fiscal 2025 the company spent roughly $590 million on property additions — against $75 million in the three years before that — with the peak year, fiscal 2022, at $132 million.
Sources: June 2026 investor presentation, Capital Expenditure History, fiscal 2016 to 2025 [30]; fiscal 2026 forecast of $80 million per the Q3 FY2026 earnings call [31].
That spending bought the Horse Cave capacity expansion, the SAP implementation, factory automation and the network moves — and it also bought depreciation. Depreciation and amortisation ran at $31.8 million in fiscal 2019 and $62.2 million in fiscal 2025 [32] [33]. As a share of net sales that is 2.44% rising to 3.26% — 82 basis points of additional non-cash cost, most of which sits in cost of sales. Gross margin in fiscal 2025, at 23.9%, was a point below fiscal 2019's 24.9%; the increase in depreciation intensity accounts for the larger part of that gap, and would account for all of it if every dollar of the charge sat above the gross profit line, which it does not. The productivity programme has been running partly to pay for the assets that enable it.
Capital intensity is now turning back up. Fiscal 2026 capital expenditure is forecast at $80 million against $58 million in fiscal 2025, and the June 2026 cash-priorities slide keeps that $80 million at the top of the list [34] [35].
Where the savings land, and where they go
Two disclosures explain the segment picture that has puzzled every chapter so far — Foodservice operating income up 19.6% over nine months while Retail fell 6.0%.
Source: Q3 FY2026 Form 10-Q, Results of Operations by segment [36] [37].
Asked in November 2025 why Retail profitability had fallen, the CFO gave three reasons, the second of which was the network move: shutting the Milpitas plant and activating College Park had "resulted in savings primarily benefiting the Foodservice" profit and loss account, adding that "eventually, we expect to see more productivity savings for Retail, but currently, Foodservice is reaping the main benefits" [38]. The nine-month Foodservice margin gain of 170 basis points is therefore substantially a network-restructuring effect with a definite completion date — Milpitas production ended in August 2025 — rather than a change in the segment's demand or pricing [39]. The 10-Q adds a second named driver, "the benefit of recent IT investments to support a more optimized trade spend system" — the return on the SAP spending, arriving in one segment [40].
That effect has already started to fade. Foodservice operating income fell 2.6% in the March 2026 quarter, and the margin gave back 50 basis points to 12.5%, which the filing attributes to inflationary costs partially offset by the cost savings programmes [41].
The consolidated question is what happens to the savings once they arrive. In August 2025 the CFO set out the fiscal 2026 algorithm explicitly: gross margin growing "probably in the around the 50 basis point range" with overheads growing with inflation, producing low-single-digit revenue growth and mid-single-digit earnings growth [42]. The margin leg came in at or above plan. The overhead leg did not: selling, general and administrative expense rose 7.2% to $180.3 million over nine months [43], against reported net sales growth of 2.2% and adjusted growth of 0.9% [44].
Sources: FY2025 Form 10-K, Results of Consolidated Operations [45]; Q2 FY2026 Form 10-Q, Gross Profit and Selling, General and Administrative Expenses [46]; Q3 FY2026 Form 10-Q, Gross Profit and Selling, General and Administrative Expenses [47].
Over nine months, $12.1 million of overhead growth consumed 88% of the $13.7 million the cost programme produced, against 52% across fiscal 2025 [48] and 54% over the first half of fiscal 2026 [49]. In the March quarter alone the ratio inverted entirely: gross profit rose $1.3 million while overhead rose $5.4 million, and reported operating income fell $3.3 million [50] [51]. Had overhead grown at 3% rather than 7.2%, nine-month operating income would have been about $7 million higher, roughly $0.20 a share after tax. The named uses are marketing behind the Retail brands, personnel and information technology, and $3.5 million of Bachan's acquisition costs [52]. These are choices, and the CFO has described marketing spend as still "lower than many peers" and worth continuing [53].
The absorption is not company-wide. The segment note shows Foodservice converting 94% of its $17.1 million nine-month gross-profit gain into segment operating income, on segment overhead up $0.4 million; Retail overhead rose $6.9 million and unallocated corporate expense $4.9 million, together $11.8 million of the $12.1 million consolidated increase [54]. The overhead that consumed the savings sits behind the Retail brands and at the centre, not in the segment that generated most of the gross-profit gain.
The condition attached to the runway
Soybean oil is about 10% of cost of goods sold, and roughly half of US crush oil now goes to renewable diesel rather than the food supply [55]. It is the input the 26% to 27% aspiration was explicitly conditioned on [56], and it is the input that produced the 520-basis-point collapse of fiscal 2022 [57].
The disclosure moved materially between August 2025 and May 2026. On the fiscal 2025 fourth-quarter call the CFO said that, on internal projections and hedging, "we do not expect significant challenges or benefits from this factor" in fiscal 2026, with the price having run from the mid-40s to as high as 55 cents before easing to about 51 [58] [59]. Nine months later the CEO told the third-quarter call that "in the aggregate, we anticipate that inflation will continue to tick up during the months ahead" [60], and described the hedge as "intermediate-term coverage that takes us through essentially the end of the summer on board and basis, which should be more than enough time for us to be able to get into the marketplace and implement pricing" [61].
That coverage runs out at the end of the summer of 2026. The mechanics on either side of the business differ: Foodservice national accounts mark key inputs to market and pass the change through, so the effect there is on reported sales rather than margin; Retail requires list-price increases to be negotiated and accepted, which is the leg management named as the one to watch, adding that the company is "in a much better position … than we were in 2022" [62]. The March-quarter Foodservice margin decline attributed to inflationary costs is the first quarter in which that shows up in the reported numbers [63].
What the programme is worth from here
Taking the last full fiscal year's 23.9% as the base, the 26% to 27% aspiration sits 210 to 310 basis points away. At the 80-basis-point rate delivered in each of the past two years, that is roughly three to four years; at the 50 basis points management guides to, four to six. Each 50 basis points is worth about $9.8 million of gross profit on roughly $1.95 billion of sales, or about $0.27 a share after tax, which is 4% of a fiscal 2026 consensus near $6.75 and arrives over years rather than quarters.
The read this supports: the cost programme is not the weak link in the case. It is delivering close to its stated $20 million a year with the commodity windfall long gone, and the runway to management's own target is measured in years rather than quarters. Earnings are currently more sensitive to overhead than to productivity, on the $0.20-a-share difference set out above between 3% overhead growth and the 7.2% delivered, and overhead is a decision the company can revisit in a way it cannot revisit soybean oil.
The strongest fact against that read is the composition of the nine-month gain. A large part of it is the Milpitas-to-College Park network move, which management said was landing in Foodservice, and that move completed in August 2025 [64] [65]. In the March quarter, with the network benefit annualising and input costs turning, Foodservice operating income fell 2.6% [66]. On that composition the programme's forward output is lower than its trailing rate implies, and overhead is the more visible of the two pressures rather than the larger one.
Against that, the Retail segment did what a working cost programme should: operating income rose 3.4% in the March quarter on sales down 3.2%, attributed by the 10-Q to the cost savings programmes and inflationary pricing [67] [68] — and the savings management said would reach Retail "eventually" had not yet arrived when it did so.
The August 2026 fourth-quarter print and the fiscal 2026 Form 10-K land within weeks, and two readings there would change this view. Overhead growth returning toward inflation while adjusted gross margin holds 50 basis points or better would put roughly $0.25 to $0.30 a share a year back into operating income and make the plateau case harder to sustain. A fourth quarter in which gross-margin gain falls below 50 basis points as the soybean-oil coverage rolls off, with overhead still growing at 7%, would mean the productivity programme has stopped funding earnings growth at exactly the point the balance sheet started carrying debt — and the flat-forever case in Margin of Safety, which holds earnings at today's level and credits no growth, becomes the base case rather than the downside.
One limitation is worth stating plainly. Nothing in this corpus discloses the annualised saving from the Milpitas closure, the return expected on the $80 million capital plan, or a running total against the $20 million target. The programme's output can be measured from the gross-margin line and bounded by management's single stated target; it cannot be verified line by line, because the company has never published it that way.
Category Tailwinds
Marzetti's categories are not growing. Its own Circana benchmark shows all seven packaged-food peers losing branded volume on the calendar 2021 to 2024 window while Marzetti gained 5.4% a year; on the calendar 2022 to 2024 window the same slide prints beneath it, two of the seven turn positive. Through fiscal 2026 the categories it names a rate for ran between plus 0.2% and minus five points. The growth has come from share and distribution — and on the lines the company breaks out, it already holds about 23% of a $5.9 billion scan base.
The peer benchmark the company publishes itself
The most direct evidence on category demand is a slide Marzetti puts in its own investor deck. Using Circana data for branded items across Total US All Outlets, it compares its own consumption growth with seven packaged-food peers of $1.2 billion to $25 billion of enterprise value — B and G Foods, Campbell Soup, J and J Snack Foods, McCormick, Post Holdings, Hain Celestial and J.M. Smucker. Over calendar 2021 to 2024, Marzetti's branded volume compounded at 5.4% a year. Every one of the seven declined on that window, from minus 0.6% to minus 18.0% [1]. That reading holds only on the three-year window. The same slide prints a second table directly beneath it for calendar 2022 to 2024, where Marzetti compounded at 6.8% and two of the seven peers turn positive on volume, at 0.9% and 0.2% [2].
Source: September 2025 investor presentation, Circana branded-item data for Total US All Outlets, peers anonymised by the company; window is calendar 2021 to 2024, the longer of the two the slide prints — on its calendar 2022 to 2024 window two of the seven peers show positive volume growth [3].
Two things follow. The first is that the group's dollar growth — positive for five of the seven despite falling volume — is pricing, not demand. The second is that Marzetti's outperformance is not a rising tide. If the tide were rising, the peers would be rising with it.
What the categories did in fiscal 2026
Management gives category growth only intermittently, but it gives brand growth and market share every quarter, and those two determine the third. Where a brand grows at rate g and its share moves from s to s', the category grew by (1 + g) × s / s' − 1. The derivation is checkable: it puts the frozen garlic bread category down 1.4% in the March 2026 quarter, and on the same call the CEO put it "down about 1.5%" [4].
Sources: FQ1 2026 call, 4 November 2025 [5]; FQ2 2026 call, 3 February 2026 [6]; FQ3 2026 call, 4 May 2026 [7] [8] [9]; category growth derived from disclosed brand growth and share movement except where marked disclosed.
Frozen dinner rolls is the exception, and it is not really an exception: Marzetti and its licensed Texas Roadhouse brand hold 61% of that category [10], so a 27% brand quarter mechanically prints a 15% category. A category Marzetti is two-thirds of is not an independent tailwind.
Everywhere else the categories are flat to shrinking. Shelf-stable sauces and condiments grew 0.2% in the September 2025 quarter while Chick-fil-A sauces grew 9.6% [11]. Produce dips turned negative in the December quarter. And in the March 2026 quarter, when Retail pounds shipped fell 5.6% [12], the first two of the three reasons management gave were January and February weather and "category softness in both produce dressings as well as pourable dressings, where the category is down about five points" [13]. Total scan sales across the company's core and licensed brands ran plus 2.3% in the December quarter and plus 0.2% in the March quarter [14] [15].
Where the share runway is
The company's investor deck carries an appendix of Circana brand positions for the 52 weeks to 29 June 2025 — brand dollars and brand share, established in The Licensing Engine. Dividing one by the other gives the size of each category, and for five of the seven the deck states the total independently, which confirms the arithmetic: produce dressing $546.1 million [16], produce dip $193.9 million [17], frozen garlic bread $853.7 million [18], frozen dinner rolls $313.8 million [19], croutons $315.8 million [20].
Source: June 2026 investor presentation, Appendix B brand and category data, Circana Total US Multi-Outlet, 52 weeks ending 29 June 2025 [21] [22]; category totals for shelf-stable pourable dressing and prep and finishing sauce derived from brand dollars divided by brand share, the other five as stated by the company [23] [24].
The seven categories are worth about $5.92 billion of retail scan value. Marzetti's own and licensed brands account for $1.39 billion of that, or 23.5%. But the distribution is extreme. In the three categories where it is already the leader outright — produce dip at 81.6%, frozen dinner rolls at 61.1%, frozen garlic bread at 42.4% [25] — there is $649 million of shelf it does not hold. In the two largest categories, where it is small, there is $3.26 billion: shelf-stable pourable salad dressing is a roughly $2.64 billion category in which the licensed Olive Garden line holds 6.5%, and prep and finishing sauce is a roughly $1.06 billion category in which Chick-fil-A and Buffalo Wild Wings sauces together hold 25.4% [26]. Roughly 72% of the dollars Marzetti does not own sit in those two.
That is the shape of the remaining runway, and it explains where the strategy points. The licensing programme, and the $400 million paid for Bachan's [27], aim at sauces and dressings — which management now describes as two-thirds of consolidated net sales, with sauces alone approaching 40% [28].
Two limits on this arithmetic. Marzetti's own shelf-stable dressings, sold under Marzetti, Cardini's and Girard's [29], compete in the pourable dressing category but are not broken out in the appendix, so 6.5% is the licensed line alone and the company's true share of that category is higher — the 23.5% aggregate is a floor, not a point estimate. And the deck supplies a category pie for each of the five categories it leads and none for the two largest.
The other half of the business runs on restaurant traffic
Foodservice was 47% of net sales in fiscal 2025 — dressings and sauces 35 points of the consolidated mix, frozen breads and other 12 [30]. Its demand driver is US restaurant traffic, and management has been describing that traffic to analysts for three years. In September 2023: trailing-52-week traffic across all restaurants flat, the trailing 12 weeks down 100 basis points [31]. A year later: July down two points, August down two, September down one, quick-service traffic down one for the quarter [32]. In August 2025: commercial foodservice "steady or has seen slight improvements… very close to flat", with quick-service traffic stabilising but "still below historical levels" [33]. In February 2026, asked to frame the industry: "essentially they're flat" [34].
Three years of flat-to-negative traffic is the backdrop against which the Foodservice book grew. It grew on mix rather than on the market: five of the seven largest national accounts grew sales and traffic in the September 2025 quarter, led by Chick-fil-A [35]. The underlying volume is close to still. Stripping out the temporary supply agreement, Foodservice pounds shipped rose 0.3% across the first nine months of fiscal 2026 and 0.8% in the March quarter; the reported 2.3% adjusted sales growth over the nine months is largely inflationary pricing [36].
Input costs move revenue, not margin
About 75% of Foodservice sales sit with large national accounts whose contracts mark key ingredients to market quarterly, so commodity moves pass into price in both directions [37]. Commodity inflation is therefore a reported-sales tailwind rather than a margin one, which matters for how a Foodservice growth rate should be read. One input carries a structural bid: soybean oil is roughly 10% of cost of goods sold, and about half the oil from the US soybean crush is now directed into renewable diesel rather than the food supply [38]. Management runs a structured forward purchasing programme rather than derivative hedges [39] and expects no significant help or hindrance from soybean oil in fiscal 2026 [40].
What sits underneath category demand
Three structural facts bear on whether these categories get better or worse.
Weight-loss drugs appear in Marzetti's own risk factors, where the company notes consumers "using weight-loss drugs to reduce consumption overall or change consumption patterns" among the preference shifts that could reduce demand [41]. Flowers Foods, a bakery peer that sells into the same aisles, states the exposure directly: GLP-1 agonists "may suppress a person's appetite, may impact demand for our products", in the same risk factor in which it records that the fresh packaged bread category "has experienced volume declines in recent years" [42]. Management's answer is that flavour is the defensive part of the plate — it expects consumers to "continue to seek flavor enhancements for their meals" in an era of GLP-1s [43]. McCormick, the closest listed comparable on flavour, opens its own 10-K with the claim that "demand for flavor is growing globally" [44]. That is a claim, not a measurement, and McCormick sits inside the seven-peer set whose US branded volume declined on Marzetti's own slide.
Private label is already the largest single position in one of these categories and a named force in another. It holds 43.2% of the crouton category, against 28.2% for all four Marzetti crouton brands combined [45]. In frozen garlic bread, where the category was shrinking and New York Bakery growing, the CEO described the structure as "closing in on more of a two-brand set: our brand and private label at select retailers" [46]. In frozen dinner rolls, by contrast, private label is only 4.6% [47].
The hedge management points to is the two-sidedness of the portfolio: when consumers pull back from restaurants and eat at home, the Retail book benefits; when operator traffic softens, chains respond with menu innovation, which is where Marzetti's custom sauce work sits [48]. Fiscal 2026 tested that hedge and it held only partially: both sides softened at once, Retail on category and club-channel effects and Foodservice on flat traffic.
The read, and what would move it
There is no category tailwind behind Marzetti. Outside frozen dinner rolls, the two category growth rates management disclosed through fiscal 2026 were plus 0.2% and minus five points, and the rates derived from disclosed brand growth and share movement ran between plus 1.3% and minus 1.4%; its own peer benchmark shows the wider packaged-food group losing branded volume across calendar 2021 to 2024, and the dollar growth the group does report is price. What Marzetti has instead is a share-and-distribution engine that has worked: share rose in five of its seven categories in fiscal 2025 [49], and in every category where a share change was disclosed across the three quarters of fiscal 2026, including the March quarter when volumes fell hardest. The share arithmetic left to that engine is lopsided: the three categories where it holds 42% to 82% leave $649 million of scan dollars it does not own, while pourable dressings and prep and finishing sauces — where it holds 6.5% and 25.4% — leave $3.26 billion, roughly 72% of the total it does not own, against national competition.
The strongest fact against reading this as a ceiling is the fiscal 2025 frozen garlic bread quarter, where New York Bakery grew 10.0% against a category up 3.5% and added 260 basis points of share while already holding more than 40% of the category [50]. High share has not yet stopped share gains. Nor has the absence of a category tailwind stopped the company compounding branded volume at 5.4% a year while every peer shrank.
What would change the read in either direction is observable each quarter without waiting for a filing. Share gains stalling in the two low-share sauce and dressing categories — where the Chick-fil-A sauce share gain has already decelerated from 17 basis points to 13 to 5 across the three fiscal 2026 quarters [51] [52] [53] — would say the runway is closing faster than the strategy can use it. Category growth turning positive, or restaurant traffic moving above flat for two consecutive quarters, would mean the demand backdrop had started adding to volumes rather than subtracting from them.
Limitation: category growth rates outside the ones management states are derived from disclosed brand growth and share movements, and carry the rounding in those disclosures — the derivation reproduces the one category growth rate management did give to within a tenth of a point. Independent industry data on US dressing, sauce and frozen bread category growth could not be obtained: the run's web research provider returned an insufficient-credit error, so every category figure here comes from Marzetti's own Circana citations or a peer filing.
The $400 million purchase
Marzetti paid $400 million for a brand with $87 million of sales — 4.6 times revenue, against about 1.6 times enterprise value to forward revenue for the parent (Margin of Safety) — and financed it with the first debt on this balance sheet in years [1] [2]. On management's own year-one guidance the purchase earns roughly $10 million of operating income against roughly $19 million of financing cost [3]. That puts the price at roughly 20 to 40 times the operating income the brand is currently expected to produce, the width of the range depending on whether the guided total-company margin or the Retail-segment margin the CFO also named is the right basis. Every branded acquisition of the prior decade was exited and written off [4] [5].
What was bought, and on what terms
Bachan's, Inc. makes Japanese barbecue sauce. Marzetti signed on 2 February 2026 [6] and closed on 1 May 2026, paying $400 million subject to customary adjustments, funded with cash on hand and a $200 million term loan drawn on 29 April [7]. The brand's net sales for the twelve months to 31 December 2025 were approximately $87 million [8], compounding at 48% a year over the preceding three [9].
Purchase Price ($M)
Multiple of Sales
Year-1 Operating Income ($M)
Year-1 Financing Cost ($M)
Sources: purchase price and term loan, Q3 FY2026 Form 10-Q [10]; sales and margin guidance, Q3 FY2026 earnings call [11]; year-one operating income and financing cost derived, workings below.
What was not disclosed matters as much. The announcement deck's value-creation slide promises growth, margin accretion, "several streams of synergies that are expected to be phased in over time" and no change to dividend policy — with no synergy figure, no earnings accretion figure, and no multiple of profit [12]. Three months later the guidance was still framed in sales and margin, not earnings: a fourth-quarter run-rate "moderately above the $87 million," at "an operating margin similar to The Marzetti Company's current level" [13]. Pressed on which level, the CFO confirmed total company rather than Retail, and added that Bachan's operating margins sit "slightly below our existing Retail" because it is an invest-to-grow brand, while being "nicely margin-accretive" at the gross line [14].
Marzetti's consolidated operating margin was 11.5% in fiscal 2025 [15] and 12.4% over the first nine months of fiscal 2026 [16]. Applied to sales of $87 million to $95 million, that guidance implies $10 million to $12 million of annual operating income, and a price of 33 to 40 times it. The basis carries most of that figure. The CFO's next sentence placed Bachan's operating margins "slightly below our existing Retail" [17], and Retail's fiscal 2025 segment margin was 21.1% [18]; on that basis the same $87 million to $95 million of sales carries $16 million to $20 million of operating income and the price is 20 to 25 times. The range the disclosure supports is about 20 to 40 times the profit the business is currently expected to produce, and which end applies depends on whether Bachan's settles at total-company or Retail-segment economics.
The record the market is pricing against
An analyst put the issue on the record the morning the deal was announced, describing market skepticism about a spotty acquisition track record and prior deals as "taking big swings… focused on addressable market expansion" [19]. The filings support the characterisation.
Sources: Angelic acquisition date, FY2021 Form 10-K Note 4 [20]; Bantam and Omni prices, FY2021 Form 10-K Note 2 [21]; Bantam and Angelic charges, FY2022 Form 10-K [22]; Flatout impairment and product-line exit, FY2024 Form 10-K [23]; Atlanta plant, FY2025 Form 10-K Note 2 [24]; Bachan's, Q3 FY2026 Form 10-Q [25].
Bantam Bagels was bought in October 2018 for a base price of $33.1 million plus an earn-out whose initial fair value was set at $8.0 million [26]. By fiscal 2022 the board had approved an exit and the company took $25.7 million of restructuring and impairment charges against it, including $7.6 million of plant [27] and $13.2 million written off the tradename, customer relationships and know-how [28] [29]. The same year an $8.8 million charge wrote down Angelic Bakehouse's tradename [30]. In fiscal 2023, $25.0 million came off Flatout's intangibles [31]. In March 2024 both bakery businesses were shut: production ceased, the real estate and equipment were sold, and the company gave its own reason — "a lack of scale and direct-to-store distribution capabilities for these products," so "we were not able to achieve the desired operational or financial performance" [32].
The clearest trace is on the balance sheet. Acquired intangible assets, net, fell from $65.2 million at June 2020 to nothing by June 2024, and were still nil a year later.
Sources: FY2021 Form 10-K Note 7 for fiscal 2020 and 2021 [33]; FY2022 Form 10-K [34]; FY2023 Form 10-K [35]; FY2024 Form 10-K [36]; FY2025 Form 10-K [37].
Every dollar of brand value the company had ever recognised on its balance sheet had been written off or amortised away by June 2024, and the balance was still zero at June 2025 [38]. Goodwill is the counterweight and it argues the other way: $208.4 million carried unchanged from fiscal 2020 through fiscal 2024 and never impaired, rising to $222.8 million only when the Atlanta plant was bought [39]. The failures were the newer, smaller brands, not the core.
The cost showed up in reported earnings. Restructuring and impairment charges ran at $35.2 million, $25.0 million and $14.9 million in fiscal 2022, 2023 and 2024, against $0.9 million and $1.2 million in the two years before [40] [41]. Management quantified the per-share hit itself: $0.98 in fiscal 2022 and $0.70 in fiscal 2023 [42], and $0.49 in fiscal 2024 for the bakery exit including a $0.07 inventory write-down [43]. That is $2.17 a share of disclosed exit cost over three years, against fiscal 2022 diluted earnings of $3.25 [44].
The year-one arithmetic
The $200 million term loan carries an interest rate "currently less than 5%" [45], so roughly $10 million a year. The other $200 million came out of cash that was earning something: fiscal 2025 Other, net was $7.1 million against an average cash balance of about $162 million [46] [47], an implied 4.4%, and forgoing $200 million of it costs about $8.7 million. The two together are about $18.7 million of pre-tax cost against the $10 million to $12 million of acquired operating income the guided margin implies, a first-year pre-tax shortfall of $8.7 million on the lower figure and $6.7 million on the higher.
Source: derived from management's fourth-quarter guidance and disclosed debt cost [48] and from fiscal 2025 Other, net and cash balances [49] [50].
A pre-tax shortfall of $8.7 million is about $6.7 million after tax at the 23% rate management guides to [51], or roughly $0.24 a share on 27.4 million diluted shares [52]. That is before purchase accounting. The allocation will not be filed until the fiscal 2026 Form 10-K, but the shape is predictable: a brand with a co-manufactured supply chain and $87 million of sales carries little in the way of plant, so most of the $400 million lands in goodwill and amortisable intangibles. Marzetti has historically amortised tradenames over 20 to 30 years and customer relationships over 2 to 15 [53]. If 40% to 60% of the price is allocated to amortisable intangibles at a 20-year average life, the annual charge is $8 million to $12 million pre-tax, another $0.22 to $0.34 a share after tax. Fully loaded, the first full year of ownership is plausibly $0.46 to $0.58 a share dilutive against a fiscal 2027 consensus near $7.22.
None of that contradicts what management said. The deck promised accretion to growth and to margins [54]; it did not promise accretion to earnings, and on the disclosed numbers it should not have. The drag is also front-loaded rather than permanent — the company generated $261.5 million of operating cash flow in fiscal 2025 and the term loan amortises against it [55].
What the brand has to become
Holding the $400 million against a 9% after-tax hurdle, the discount rate the report's valuation work uses (Margin of Safety), requires $36 million of after-tax profit, or $46.8 million pre-tax. The table below is the scale that implies at various operating margins, and how long the brand's own growth rates take to get there.
Source: derived. Hurdle of 9% after tax on the $400 million price at the 23% guided tax rate; margin benchmarks are the fiscal 2025 consolidated margin of 11.5% and Retail segment margin of 21.1% [56] [57]; growth rates are the brand's disclosed three-year net revenue CAGR of 48% [58] and an illustrative 25% a year.
On the margin management actually guided to, Bachan's has to reach roughly $400 million of sales — about a fifth of Marzetti's own annual revenue — to clear a 9% return. On Retail-segment economics, which is where the CFO says the brand will settle once the invest-to-grow spending normalises [59], it needs to grow to roughly two-and-a-half times today's sales, which four years of 25% growth would deliver.
That is not an implausible ask against the brand's disclosed record: net revenue compounded at 48% a year over the three years to calendar 2025 [60]. What the return depends on is which growth rate persists and for how long, which is the sensitivity the table above sets out. Marzetti's own Retail base moved the other way in the March 2026 quarter, with pounds shipped down 5.6% [61] (The Licensing Engine).
The case against reading this as the prior deals
The three failures share a description that Bachan's does not fit. Angelic Bakehouse and Flatout were perimeter-of-the-store bakery, closed for what the company described as "a lack of scale and direct-to-store distribution capabilities for these products" [62]; Bantam was frozen stuffed bagels, undone when a single foodservice customer rationalised its SKUs [63]. Bachan's is a branded shelf-stable sauce, sold through the grocery and club channels Marzetti already serves, made on the kind of filling line the company has spent a decade rebuilding. The acquisition criteria published in June 2026 name that fit explicitly: branded retail shelf-stable sauces, demonstrated growth, strong financial results with margin accretion [64]. The CEO's own account is that the company spent the intervening years declining assets — "we looked at assets to buy, but the prices didn't make sense" [65] — and had tracked this one for four years before bidding [66].
Asked why now, the CEO described licensing as the pathway the company took instead of buying, and estimated it had added "$400 million plus or so of profitable revenue" [67]. Marzetti has now paid the same $400 million in cash to acquire $87 million of revenue. The defence of that trade is straightforward: licensed revenue is rented, the growth it delivered has stalled, and an owned brand cannot be withdrawn by a licensor. Whether ownership is worth roughly three times the revenue multiple the market applies to the parent is a judgement about Bachan's growth rate, not about the merits of ownership in the abstract.
The read here is that the deal is expensive against what it earns today and defensible on growth alone — and that management has bought a growth asset while guiding it as a margin asset. The strongest facts against that read are the brand's growth rate and the cash behind it: net revenue compounded at 48% a year over the three years to calendar 2025 [68], and fiscal 2025 operating cash flow of $261.5 million [69] services the term loan while the brand scales. The first full-year plan is what would settle it. If the August 2026 call frames Bachan's at a Retail-segment margin with a credible path through $150 million of sales, the price stops looking like a stretch; if "moderately above $87 million" is still the framing a year on, the return on $400 million stays close to the numbers above.
What this commits the company to
Bachan's is not being presented as a one-off. Closing the third-quarter call, the CEO described it as "the first of what we believe will be more acquisitions in an area that we are calling authentic flavors," and a new growth leg alongside legacy brands and restaurant licences [70]. The June 2026 deck restates cash priorities in the same order it always has — capital expenditure of about $80 million, good-fitting acquisitions, the dividend, opportunistic repurchases — but now lists two acquisitions under the second heading [71]. What is being underwritten, then, is a policy: a company that spent seven years growing by renting other people's brands now intends to buy them, at prices set in the private market, funded increasingly by debt, under incentive plans that contain no measure of return on capital (Ownership and Pay).
Three things settle most of this, and all three land within a year: the fiscal 2026 Form 10-K purchase price allocation, which fixes the amortisation charge; the August 2026 call, which brings the first completed operating plan for the brand; and the October 2026 proxy, which will show whether the compensation committee added a capital measure after committing $400 million.
Two limits on the analysis above should be stated plainly. Neither Marzetti nor any filing in the record discloses Bachan's profit, its EBITDA multiple, or a synergy figure, so the return arithmetic rests on management's margin guidance rather than on acquired-company financials. And the size and growth rate of the US barbecue sauce category appear nowhere in this corpus; the run's web research was unavailable, so the headroom test that would place Bachan's $87 million inside a category denominator (Category Tailwinds) could not be run for this brand.
Ownership and Pay
The Gerlach family's block is large, old and static: about 27.5% of the shares, roughly $30 million a year of dividend income at the current rate, and not one open-market purchase anywhere in the Form 4 record. The operating team's stake is grant-built — the CEO holds 0.21% of the company. Every financial measure in the incentive plans is sales, operating income or relative share performance; none is margin, cash flow or return on capital.
Who owns the company
Ownership above five percent is concentrated in one family and two index managers. John B. Gerlach, Jr. is shown at 7,510,191 shares, or 27.3% of the 27,547,758 shares outstanding at 22 September 2025; his mother, Dareth A. Gerlach, at 5,927,117 shares, or 21.5%; and the John B. Gerlach Trust A-1 at 5,737,602 shares, or 20.8% [1]. Those three lines overlap heavily. The Trust A-1 holding, and a further 137,430 shares in a 1974 taxable trust, appear in both Gerlach totals, so the family's combined non-overlapping position is 7,562,276 shares — 27.5% of the class. BlackRock is disclosed at 9.4% and Vanguard at 7.6%, both from 13G/A filings dated early 2024 [2].
Sources: 2025 Proxy Statement, beneficial-ownership tables [3] [4]; family total derived by removing the trust shares counted twice.
All executive officers and directors as a group — 14 people — hold 8,004,202 shares, 29.1% of the class. Within that, director Robert L. Fox holds 976,416 shares (3.5%), mostly through charitable foundations and a jointly-owned corporation. The CEO, David A. Ciesinski, holds 59,011 shares, 0.21% of the company [5].
Where the votes actually sit
The 27.3% headline overstates what the family's most visible member controls. The proxy footnote itemises his position, and most of it carries no voting or dispositive power for him at all: 5,737,602 shares in Trust A-1 and 137,430 in the 1974 taxable trust are held with Mr. Gerlach as trustee "with no power to vote or dispose of the shares," his mother serving as special trustee with sole power; a further 316,387 shares are his spouse's, with sole power held by her [6].
Source: 2025 Proxy Statement, footnote (2) to the beneficial-ownership table [7]; balance line derived as the residual.
On the proxy's own disclosure, 6,191,419 shares — 22.5% of the class — sit outside his voting and dispositive power. The sole power over the two trusts belongs to Dareth A. Gerlach, who is not a director and whose only appearance in the proxy is as a five-percent owner and as the mother of a director [8]. The block votes as a family bloc in practice; the point is that the disclosed decision right over the largest single holding rests with someone outside the boardroom, and the arrangements governing its succession are not in the public record.
The family's operating role ended some time ago. John B. Gerlach, Jr. has been a director since 1985 and was chief executive from 1997 to June 2017, then Executive Chairman until he retired from that post in December 2023 [9]. Marzetti is family-owned and professionally run, and the two facts point in different directions: the family's block decides the outcome of any shareholder vote while holding no executive role, and the operating team that sets strategy holds stakes built from grants rather than purchases.
What the block is paid
At the $1.00 quarterly rate now running [10], the family's 7,562,276 shares collect about $30.2 million a year, and the officers-and-directors group about $32.0 million, against a total dividend bill of roughly $110 million on the 27.4 million shares outstanding at 31 March 2026. The company has raised its regular dividend for 62 consecutive years through fiscal 2025 [11]. The largest holders are paid in dividends rather than in realised gains, and the streak is what protects that income.
Repurchases are the alternative use of that cash, and the record is thin. The share repurchase authorisation in force dates from November 2010; of the 2,000,000 shares approved then, 1,083,830 remained unused at 30 June 2025 — under half the authorisation consumed in fourteen and a half years [12].
Sources: Form 10-Q for the quarter ended 31 March 2026, statements of shareholders' equity [13] and cash flows [14]; average closing prices derived from daily market data.
The pattern inside fiscal 2026 is worth stating precisely. The company bought $20.1 million of stock in the December 2025 quarter — 123,000 shares, about $163 each — after buying only $8.0 million across the whole of fiscal 2025 [15]. It then bought $16,000 in the March 2026 quarter, a quarter in which the shares traded as low as $137.13 [16]. Dividends of $81.4 million were paid over the same nine months [17]. The obvious defence is timing rather than reluctance: the $20.1 million of buying fell in the December 2025 quarter, the Bachan's acquisition was announced on 3 February 2026, and the $16,000 quarter is the one in which cash was being held for a $400 million purchase. What the June quarter did is not yet disclosed; the fiscal 2026 Form 10-K had not been filed as at 29 July 2026.
Skin in the game, measured
Gerlach family bloc
Family dividend income, annualised
CEO stake, % of shares
CEO FY2025 pay (SCT total)
Sources: 2025 Proxy Statement ownership tables [18] [19] and Summary Compensation Table [20]; dividend income derived at the $4.00 annualised rate.
The CEO's 59,011 shares are worth about $6.5 million at $110.19, against fiscal 2025 total compensation of $5.38 million [21]. The board requires him to hold six times base salary and reports that he meets it, with restricted stock counted toward the test [22]. That stake was built entirely from grants. Across the Form 4 record from 2019 to date, Mr. Ciesinski has sold 27,151 shares on the open market — 10,151 in November 2022 at around $209 and 17,000 on 13 February 2025 at $191.19 — and bought none.
Source: insider transaction filings (Forms 4 and 144) as filed with the SEC, 2019 to 29 July 2026 — every open-market purchase in the record. Structured filing data; no page-level PDF in this corpus.
Five open-market purchases in seven years, totalling about $1.2 million. Only one falls inside the de-rating: the chief financial officer bought 900 shares at $109.01 on 10 June 2026, $98,109, roughly 15% of his base salary. On the same two days the chief supply chain officer sold 1,221 shares at $109.31. No member of the Gerlach family has bought a share in the open market in the record; the family's only reported transactions are annual director stock grants and a single 2022 option exercise settled with the company.
Two housekeeping points sit alongside this. The proxy discloses two late Form 4 filings during fiscal 2025, one for the CEO and one for the incoming Retail president [23]. And the insider trading policy prohibits pledging shares as loan collateral and prohibits hedging outright [24] — which means no part of the family block sits behind margin debt.
What management is paid on
The annual plan is 75% financial and 25% personal. Within the financial part, adjusted operating income carries 70% and adjusted net sales 30% [25]. The long-term plan is 55% performance share units and 45% time-vested stock; the PSU half splits evenly between three-year net sales growth and relative total shareholder return against the S and P 1500 Packaged Foods and Meats Index [26]. The company's own list of the three most important measures used to determine pay is adjusted operating income, adjusted net sales and relative TSR [27].
Sources: 2025 Proxy Statement — annual incentive design and targets [28], fiscal 2025 results and payouts [29], long-term plan weightings [30] and fiscal 2023 PSU outcomes [31].
Nothing in that design charges management for capital. There is no margin metric, no cash-flow metric, no return-on-capital or per-share metric anywhere in the annual or the long-term plan. In a year in which the company committed $400 million to an acquisition at 4.6 times sales and drew a $200 million term loan against a previously debt-free balance sheet — the arithmetic is set out in Financials and Estimates — the incentive design registers the resulting revenue and, three years later, the resulting share price, but never the capital consumed to get there. It is also, on its own terms, an unusually direct wager on the sales engine examined in The Licensing Engine: 27.5% of long-term grant value pays on net sales growth alone.
The fiscal 2025 outcome shows the plan working as designed rather than generously. Adjusted net sales of $1,894.9 million came in at 98.8% of target and paid 81.0%; adjusted operating income of $229.2 million came in at 101.7% and paid 116.8%; the blended financial result was 106.1% of target [32]. Mr. Ciesinski's payout of $1,292,363 against a $1,219,000 target [33] is 106% of target, down from $1,520,404 in fiscal 2024 [34]. Two details cut in management's favour. The committee's adjusted net sales figure strips out the temporary supply agreement revenue — $14.2 million of the reported $1,909.1 million — so the plan did not pay on the one revenue line the filings describe as temporary [35]. And the relative-TSR PSU is capped at target if absolute three-year TSR is negative, regardless of relative ranking [36].
The fiscal 2023 PSUs vested in August 2025: relative TSR of 45.14% against an index return of 15.75% paid 186% of target, and adjusted net sales of $1,894.9 million against a $1,830.9 million goal paid 135% [37] [38]. That performance period closed on 30 June 2025, before the shares began falling; the fiscal 2025-2027 cycle now running spans the stall instead. The proxy discloses the target-setting convention for the earlier cycle — a 3.5% annual growth rate off the base year [39] but not the goals for the fiscal 2025-2027 grants. Applied to the fiscal 2024 base of $1,871.8 million, that convention implies a fiscal 2027 target near $2.08 billion, against consensus of $2.02 billion — a payout below target, on a derived figure that the company has not confirmed.
What a large inside stake does not buy
A 27.5% family block and a 29.1% insider group are usually read as alignment. Their more direct effect on outcomes is to foreclose a change of control. No unsolicited acquirer and no activist can carry a shareholder vote without the family, and the advance-notice provisions of the company's Code of Regulations, together with the 20 September 2026 deadline for a universal-proxy nomination notice, set the procedural cost of trying [40]. The route by which a de-rated packaged-food asset most often re-rates — someone buys it — is not available here on anything other than the family's terms.
That matters for how the pay design is policed. The 2024 say-on-pay vote drew 99.1% support [41], a figure in which the insider bloc is itself a large minority of the votes cast. Outside shareholders' influence over what management is measured on runs through a compensation committee that the same bloc helps elect.
The counter-case is real and should be weighed at the same time. The block is why the balance sheet carried no debt at all until April 2026, why the dividend has risen for sixty-two straight years, and why the borrowing taken for Bachan's was under one turn of EBITDA rather than three. The pay practices are clean by mid-cap standards: no repricing without shareholder approval [42], no tax gross-ups, no executive pension, double-trigger change-in-control vesting, a Rule 10D-1 clawback policy adopted in October 2023, an independent consultant, and payouts capped at 200% [43] [44]. An investor who wants the probability of financial distress close to zero is being served by exactly the ownership structure that also caps the ways the discount can close.
Pay against performance
The mandated pay-versus-performance table is the cleanest five-year record the company publishes of what shareholders and executives each received.
Source: 2025 Proxy Statement, Pay Versus Performance table [45]. Peer index is the S and P 1500 Packaged Foods and Meats Index; both indices are measured from 30 June 2020.
Two things stand out. The mechanism does bite: compensation actually paid to the CEO was negative $244,743 in fiscal 2022, when the shares fell, and $4.16 million in fiscal 2025 against $5.73 million the year before, as the change in fair value of unvested awards turned against him [46]. And the base rate is modest: $100 invested on 30 June 2020 was worth $122.70 five years later — 4.2% a year with dividends reinvested — while compensation actually paid to the CEO across those five years totalled $27.0 million and the tabled figure $23.9 million. The CEO-to-median-employee pay ratio for fiscal 2025 was 102 to 1, against median employee compensation of $52,692 [47].
The table stops at 30 June 2025, three days after the name change took effect [48] and about three months before the shares began falling. Extending it on the same basis — the closing price of $110.19 on 28 July 2026 and the $3.95 of dividends paid since the fiscal year end — the $100 is worth roughly $81.
Sources: 2025 Proxy Statement, Pay Versus Performance table, for the fiscal 2021-2025 points [49]; the July 2026 point is derived from the closing price of $110.19 on 28 July 2026 and dividends declared since the fiscal 2025 year end, and no peer figure is available for that date.
The fiscal 2025-2027 PSU cycle, granted in August 2024, was priced off a grant-date fair value of $193.39 for the net-sales tranche and $221.61 for the relative-TSR tranche, with the restricted stock granted alongside it cliff-vesting on 13 August 2027 [50]. The next cycle was granted in August 2025, when the CEO's associated tax-withholding transactions were struck at $180.29. At $110.19 the operating team holds a large amount of paper worth roughly half what it was booked at, which is the alignment the plan was designed to produce and is now producing.
Directors
Non-employee directors received $135,000 of restricted stock plus cash fees in fiscal 2025, with totals ranging from $212,491 to $329,991 — except for John B. Gerlach, Jr., at $745,159. The difference is $535,170 of "perquisites and other personal benefits" that the proxy attributes to business-related professional and filing fees and to payment of deferred compensation and accrued interest [51]. That is the settlement of a deferred balance accumulated over three decades as an executive rather than current-year director pay, and it should be read as such. The same table discloses that committee fees had gone unpaid after a 2017 change in board compensation structure [52]; the narrative below it names four directors, and dates the discovery to December 2024 and the corrective payment to January 2025 [53]. Eight of the ten directors are independent under Nasdaq standards, and the chair and chief executive roles are separate, with Alan F. Harris as chairman [54].
The read, and what would change it
On the evidence here: ownership is concentrated but passive, and pay is competently governed but pointed at the wrong end of the problem. The family's economic interest is realised as dividend income rather than as a re-rating, which is consistent with a fourteen-year-old repurchase authorisation still less than half used and with $20 million of buying done at $163 and none done at $137. Management's incentives run on sales, operating income and relative share performance, so a strategy of buying growth at high multiples registers in the numerator of every plan metric and never in the denominator.
The strongest fact against that reading is the pay-versus-performance record itself: compensation actually paid went negative in fiscal 2022 and fell 27% in fiscal 2025, the relative-TSR tranche is capped at target whenever absolute returns are negative, and roughly half the CEO's outstanding equity is currently marked well below grant. The design does transmit shareholder losses to the executive, with a lag of up to three years.
Three things would move the read. A material step-up in repurchases at prices near the current level, disclosed in the fiscal 2026 Form 10-K, would show the board treating the de-rating as an opportunity rather than a constraint. An open-market purchase by a member of the family, absent from the entire Form 4 record, would say more than any governance disclosure. And the addition of a cash-flow or return-on-capital measure to the fiscal 2027 incentive design — the proxy confirms the fiscal 2026 plan was left unchanged [55] — would indicate that the board has priced the change in the company's capital structure into how it pays for growth.
What $110.19 pays for
At $110.19 the equity is worth about $3.02 billion, or 15.3x the fiscal 2027 consensus. On a perpetuity discounted at 9%, that price embeds roughly 2.5% growth forever. The protection on offer is a 3.6% dividend, a 6.5% free cash flow yield and covenant headroom of roughly 90%. It is not a discount to asset value.
The multiples
Marzetti had 27,422,381 shares outstanding at 31 March 2026 [1]. At the 28 July 2026 close of $110.19 that is a market capitalisation of $3,021.7 million. The balance sheet behind it carried $218.4 million of cash, no borrowings, and $1,044.8 million of shareholders' equity at the same date [2] — the Bachan's purchase closed a month later, on 1 May 2026, for $400 million funded from cash and a $200 million term loan [3] [4].
Price, 28 Jul 2026
Market Cap ($M)
P/E on FY2027E
Dividend Yield
Sources: share count and balance sheet from the Q3 FY2026 Form 10-Q [5]; price and consensus estimates as reported.
The full stack is below. Consensus for fiscal 2026 and 2027 comes from four to six contributing analysts — a thin panel, as Financials and Estimates established — so these are reference points, not precision instruments.
Source: derived from consensus estimates and the 27,422,381 shares outstanding at 31 March 2026 [6]; trailing column uses fiscal 2025 reported operating income of $220.3 million and depreciation of $62.2 million [7] [8].
Two features of that table matter more than the headline multiple. The free cash flow yield of 6.5% is real cash: fiscal 2025 operating cash flow was $261.5 million against $58.0 million of capital spending [9], and consensus has fiscal 2026 free cash flow at $197.8 million even with capital spending guided up to the $75 million to $85 million range [10]. And the dividend absorbs a little over half of that, not all of it. The board raised the quarterly rate to $1.00 on 19 November 2025 [11], the 63rd consecutive annual increase after the 62 recorded through fiscal 2025 [12], putting the fiscal 2026 payout at $3.95 a share against a fiscal 2025 rate of $3.75 [13].
What the de-rating did to the yield
The dividend yield moved further than the earnings multiple, which Business and De-Rating already tracked. The numerator has risen every year for six decades while the denominator fell by more than a third.
Source: derived from dividends declared per share in the consolidated statements of shareholders' equity and fiscal-year-end closing prices; fiscal 2026 uses the $3.95 declared rate [14] against the 28 July 2026 close.
Between fiscal 2017 and fiscal 2025 the yield sat in a 1.52% to 2.45% band. At $110.19 it is 3.58%, roughly double the nine-year average and above every year-end reading in the series. On the fiscal 2027 consensus rate of $4.15 it is 3.77%.
The growth the price embeds
A perpetuity is a crude model for a company with two segments and a licensing programme, and it should be read as a boundary rather than a valuation. What it supplies is the perpetual growth rate the current price implies.
Taking fiscal 2026 consensus free cash flow of $197.8 million as the base and discounting at 9%, the equity value is $197.8 million divided by (9% minus g). Solving for the current market capitalisation gives an implied perpetual growth rate of 2.45%. At an 8% discount rate it is 1.45%; at 10%, 3.45%.
Source: derived from consensus fiscal 2026 free cash flow of $197.8 million and 27,422,381 shares outstanding [15].
The grid places $110.19 between the 2% and 3% growth cases. For context, revenue compounded at 7.4% a year over the five years to fiscal 2025 and 4.4% over three; consensus has fiscal 2028 revenue growing 2.0% and earnings 2.8%, on a single contributing broker. The price is therefore below the historical growth rate and roughly at the consensus terminal rate. A zero-growth business on these assumptions is worth about $80 a share; a 4% grower is worth about $144, below the $159 consensus target price carried by the two buy and three hold ratings on the stock.
Two downside cases
The largest identifiable loss is not a recession. It is the Chick-fil-A relationship, which produced $548.2 million of net sales in fiscal 2025, 29% of the consolidated total [16], split between a Foodservice supply leg and an exclusive Retail licence that The Licensing Engine decomposed at roughly $401 million and $147 million respectively.
The Licensing Engine applies the fiscal 2025 segment margins to that split and puts about $31 million of segment operating income behind the Retail licence and about $49 million behind the supply leg.
Source: derived from fiscal 2025 segment operating margins [17] [18], Chick-fil-A net sales of $548.2 million [19], a 22% tax rate and 27,422,381 shares [20].
Losing the Retail licence alone costs about $0.88 of earnings per share and, at an unchanged 15x, about $15 of value. Losing the whole relationship costs $2.29 and, at a multiple that would almost certainly compress, takes the shares into the $60s to $70s. These estimates err in both directions: the $97.9 million of unallocated corporate expense reported for fiscal 2025 would not disappear with the sales, which makes them optimistic [21], while a manufacturer of this size would cut cost against a loss of that size, which makes them pessimistic. Neither leg is contractually protected — no brand licence agreement is filed as an exhibit anywhere in the corpus, so duration and renewal terms are unreadable from the public record.
The second downside case needs no event at all. If the base business simply does not grow — the fiscal 2026 experience extended indefinitely, with adjusted nine-month earnings per share flat year on year — the perpetuity grid puts the equity near $80, about 27% below the current price. That is the arithmetic cost of the plateau outcome.
Solvency, which is a separate question
Permanent loss of capital through insolvency is a separate risk from a de-rating, and it is worth measuring against the actual covenant terms rather than a leverage headline. The credit facility carries two financial covenants: an interest coverage ratio of not less than 2.5 to 1, measured as consolidated EBIT over consolidated interest expense, and a consolidated leverage ratio of not greater than 3.5 to 1, measured as consolidated net debt over consolidated EBITDA [22]. The agreement also lets the borrower elect a 4.00 to 1.00 leverage ceiling for the twelve months after a material acquisition, an election available no more than twice over the life of the facility [23].
Against those tests, consensus has fiscal 2026 net debt at $62 million and EBITDA at $304 million — leverage of 0.20x. EBITDA would have to fall roughly 94%, to about $18 million, before the 3.5x test binds at that debt level. On interest, $200 million drawn at a rate in the mid-5% range implies roughly $11 million of annual interest against EBIT near $234 million: about 21x cover, requiring an 88% collapse in EBIT to breach. The company itself said it exceeded the financial covenants by substantial margins at 30 June 2025 and expected to remain in compliance [24], and had no borrowings outstanding at 31 March 2026 [25].
Two qualifications belong next to that. The term loan matures five years after drawing, but springs forward to 6 March 2029 if the revolver has not been extended by 6 December 2028 to a date at least as long as the term loan, with commitments at least equal to the term loan balance [26]. And a lease commitment with fixed cash payments of approximately $159 million — fifteen years of warehousing space in Columbus, Ohio — sat off the balance sheet at 31 March 2026 and commences in fiscal 2027 [27]. That undiscounted commitment is four-fifths the size of the term loan and appears in none of the leverage arithmetic above. It is an operating obligation rather than debt, but a reader counting fixed claims should count it.
Asset backing is thinner than the solvency picture suggests. Shareholders' equity of $1,044.8 million includes $222.8 million of goodwill [28], leaving tangible book value near $30 a share, about 27% of the price — and the Bachan's purchase, at $400 million for a brand whose net sales for the twelve months to 31 December 2025 were approximately $87 million [29], will add a large intangible balance when the fiscal 2026 purchase price allocation is filed. This is not an asset play. The downside protection is the cash flow and the covenant headroom, not the book.
The peer check
Marzetti's multiple is not an outlier among packaged-food companies that fell in the same window.
Source: derived from reported financials in each company's latest annual filing and closing prices to 29 July 2026. Each multiple is struck on that company's latest reported fiscal year, so Marzetti appears at 18.1x on fiscal 2025 earnings of $6.07 [30] rather than 17.2x on the trailing twelve months. Kraft Heinz and Conagra reported net losses, so no multiple is shown.
Marzetti fell 40% over twelve months and trades at 18.1x trailing earnings. McCormick fell 29% and trades at 17.7x; Flowers Foods fell 54% and trades at 19.1x on collapsed earnings; Campbell's fell 31% and trades at 11.4x. Marzetti is the only name in the group combining positive three-year revenue growth, positive branded volume growth on the Circana benchmark it publishes (Category Tailwinds), and a net cash position before the Bachan's borrowing. It is also, on trailing earnings, among the more expensive.
The read, and what would change it
The evidence points to a business priced for roughly 2.5% perpetual growth, paying 3.6% in dividends and 6.5% in free cash flow to wait, on a balance sheet where insolvency requires something close to a 90% earnings collapse. That is a defensible entry price for a durable compounder that has stopped compounding — but it is not a large margin of safety, because the multiple sits mid-pack against peers facing the same volume problem, and the concentration risk that would do the most damage is not discounted at all. A licence loss takes the shares to the $60s or $70s from a price that assumes the licence persists.
The strongest fact against this read is the free cash flow itself. Consensus has it at $197.8 million in fiscal 2026 and $207.0 million in fiscal 2027, roughly 105% of net income in both years, on a company whose March 2026 quarter marked what management described on the call as the eleventh straight quarter of gross margin improvement, driven by procurement, manufacturing, value engineering and distribution savings rather than volume [31]. A business converting earnings to cash at that rate, with the dividend at 55% of it, does not need growth to be worth holding — it needs only to not shrink.
Three things would change the read. A price near $80 would put the zero-growth case in the price and turn the concentration risk into an asymmetry rather than an exposure. Evidence that Retail volumes have resumed growth — pounds shipped fell 5.6% in the March 2026 quarter [32] — would restore the 3% to 4% growth cases and with them roughly $10 to $34 a share of value on the grid above. And a Chick-fil-A licence renewal disclosed on terms, or a filed agreement, would remove the largest unbounded item in the downside. Against that, a second consecutive year of falling Retail volume, or the Bachan's purchase price allocation revealing an amortisation charge large enough to move fiscal 2027 earnings, would push the fair range toward the flat-forever case.
Not yet in the record: the fiscal 2026 fourth quarter and full year were unreported as at 29 July 2026, and no Form 10-K had been filed. The June-2026 quarter is the first full period to include the de-rating, the Bachan's close and the term loan, and none of its numbers are available here.