The Marzetti Company's management explains the business in its own materials. The slides below do the most of that work, pulled from the documents preserved in Sources. Each source link opens the complete presentation at that slide in a new tab.
The current overview deck: what Marzetti makes, how its two segments earn money, the licensing and M&A strategy, and category share data. · Open the full document →
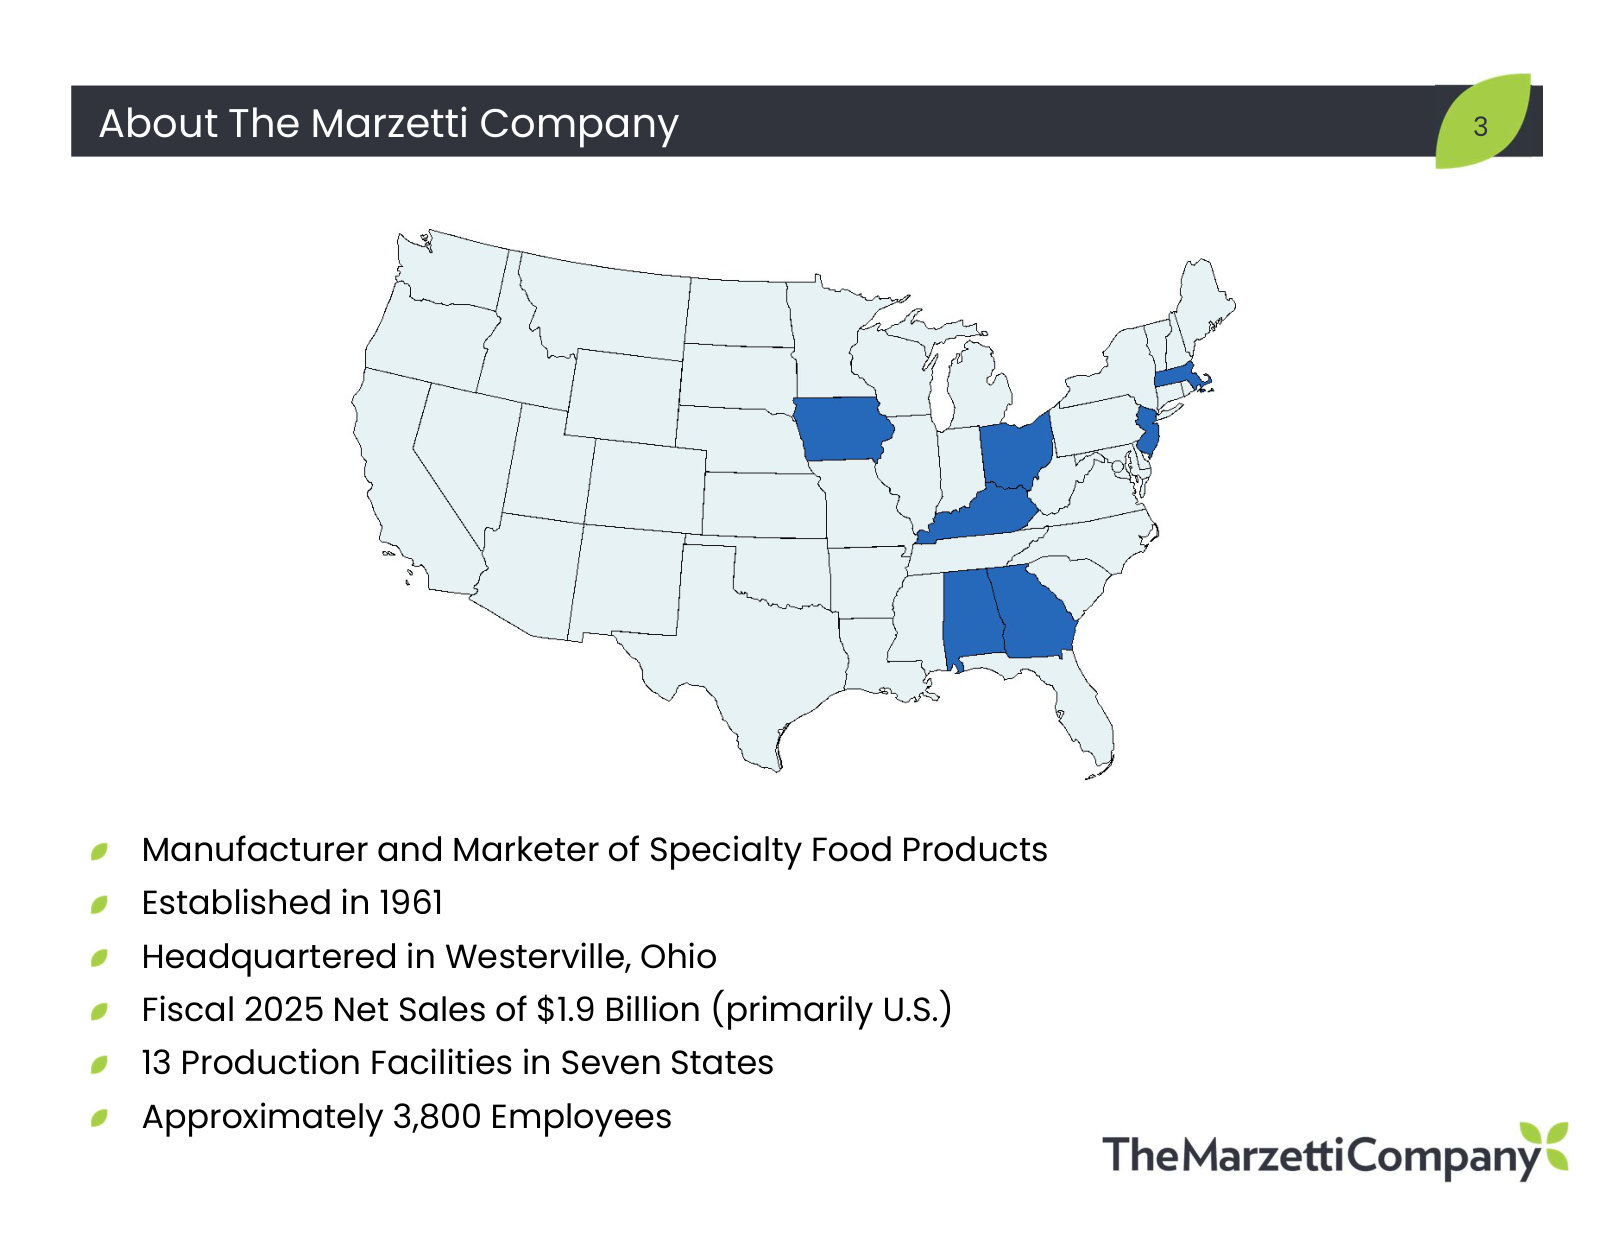
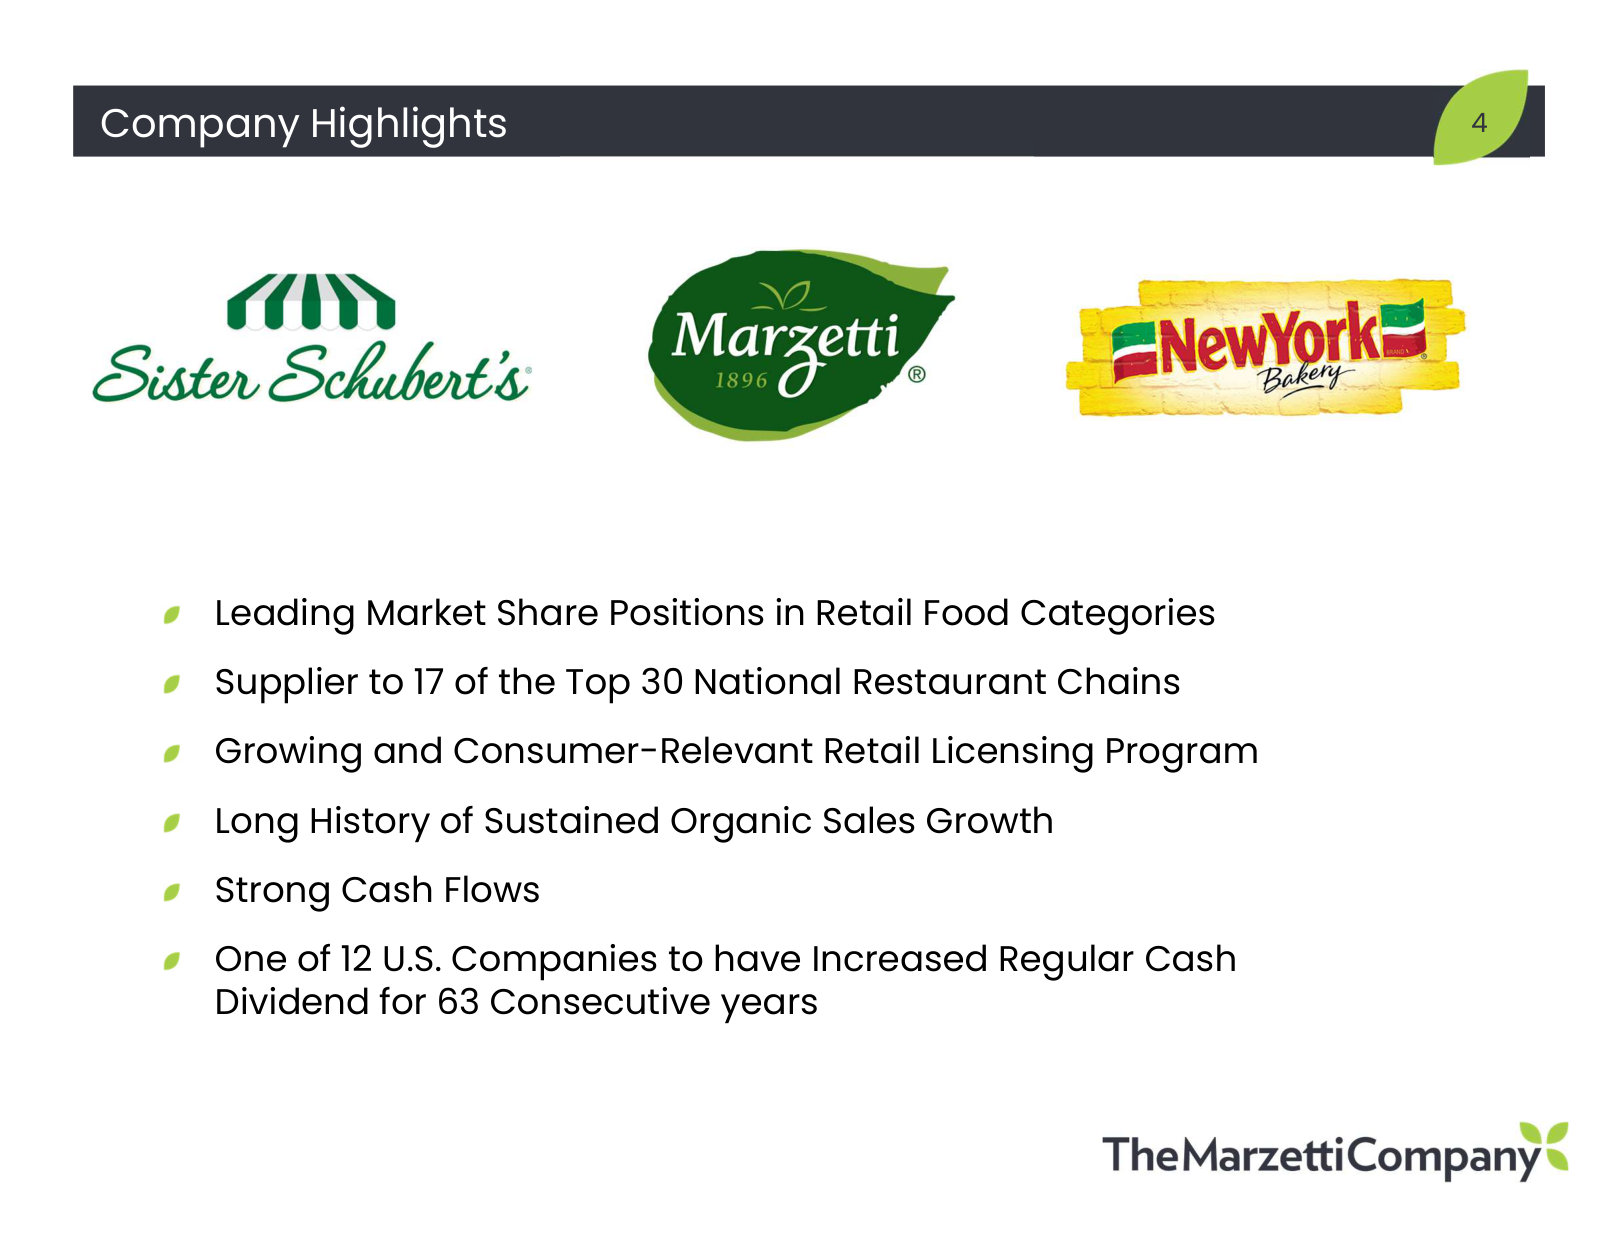
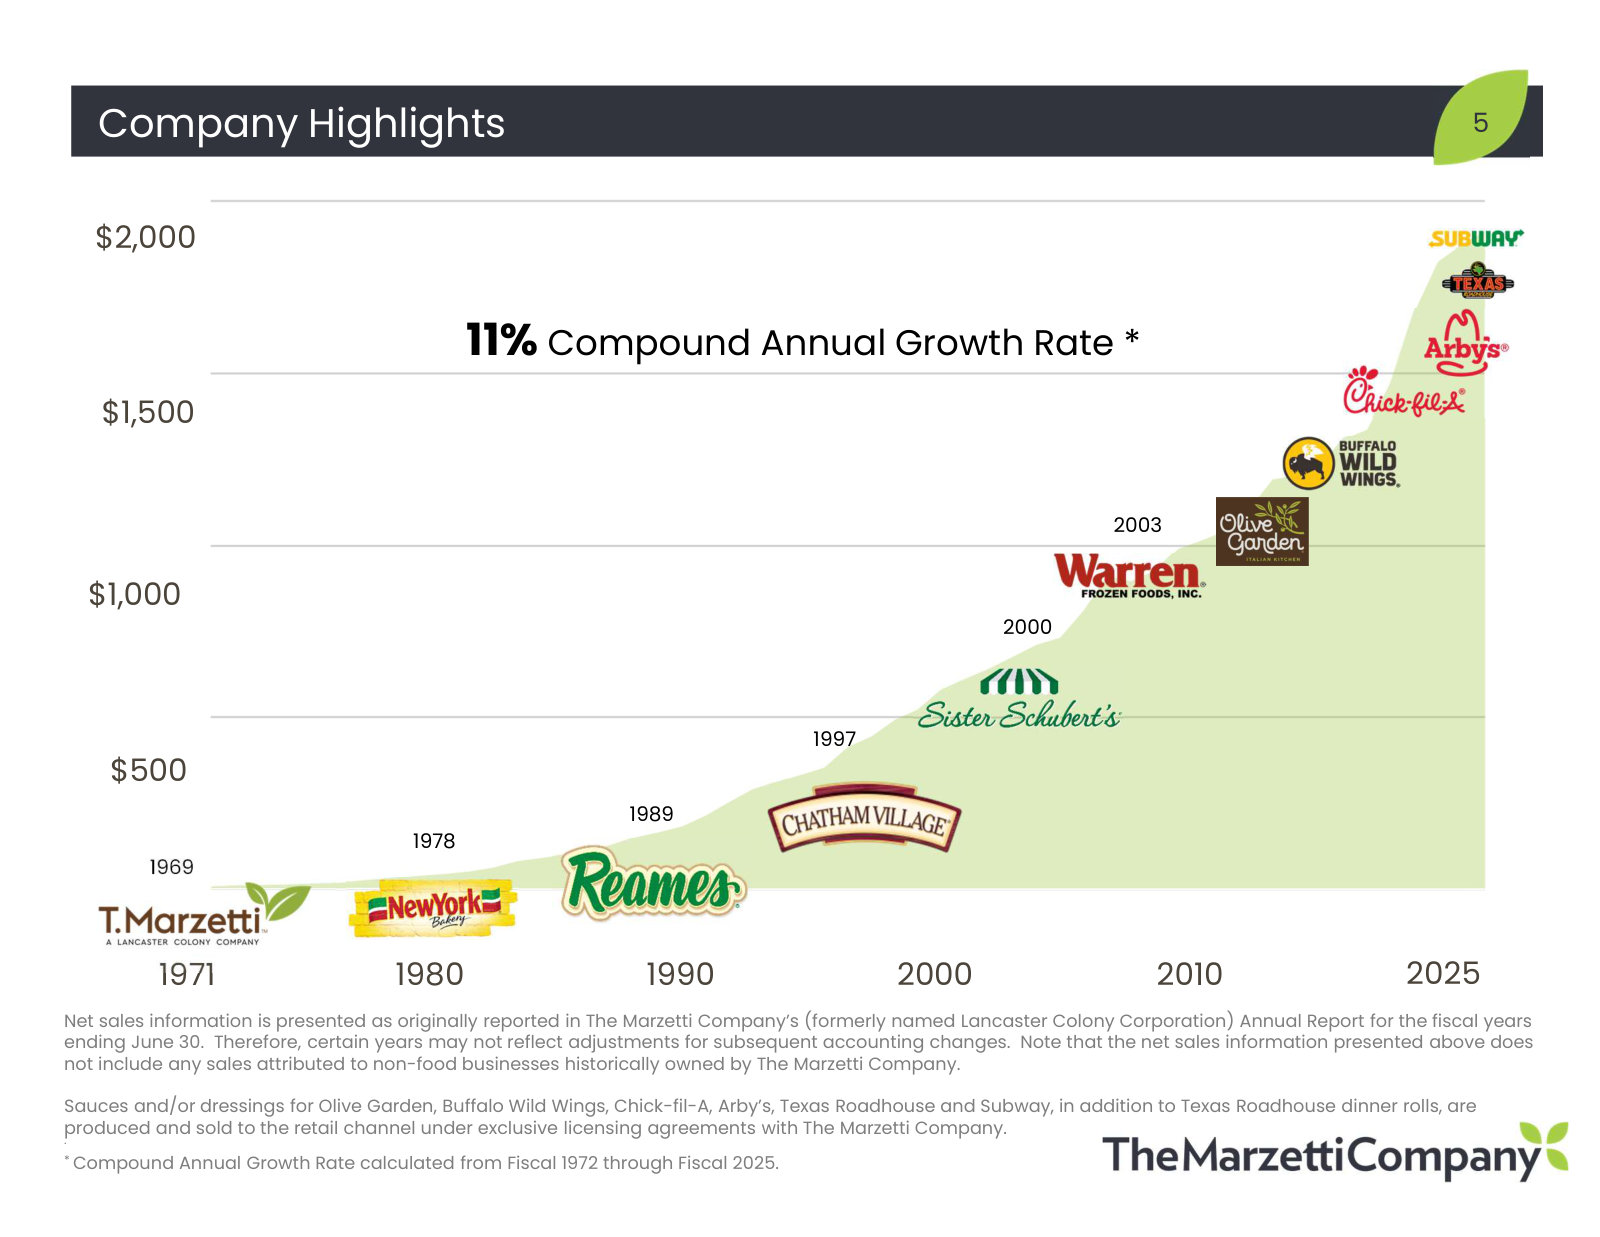
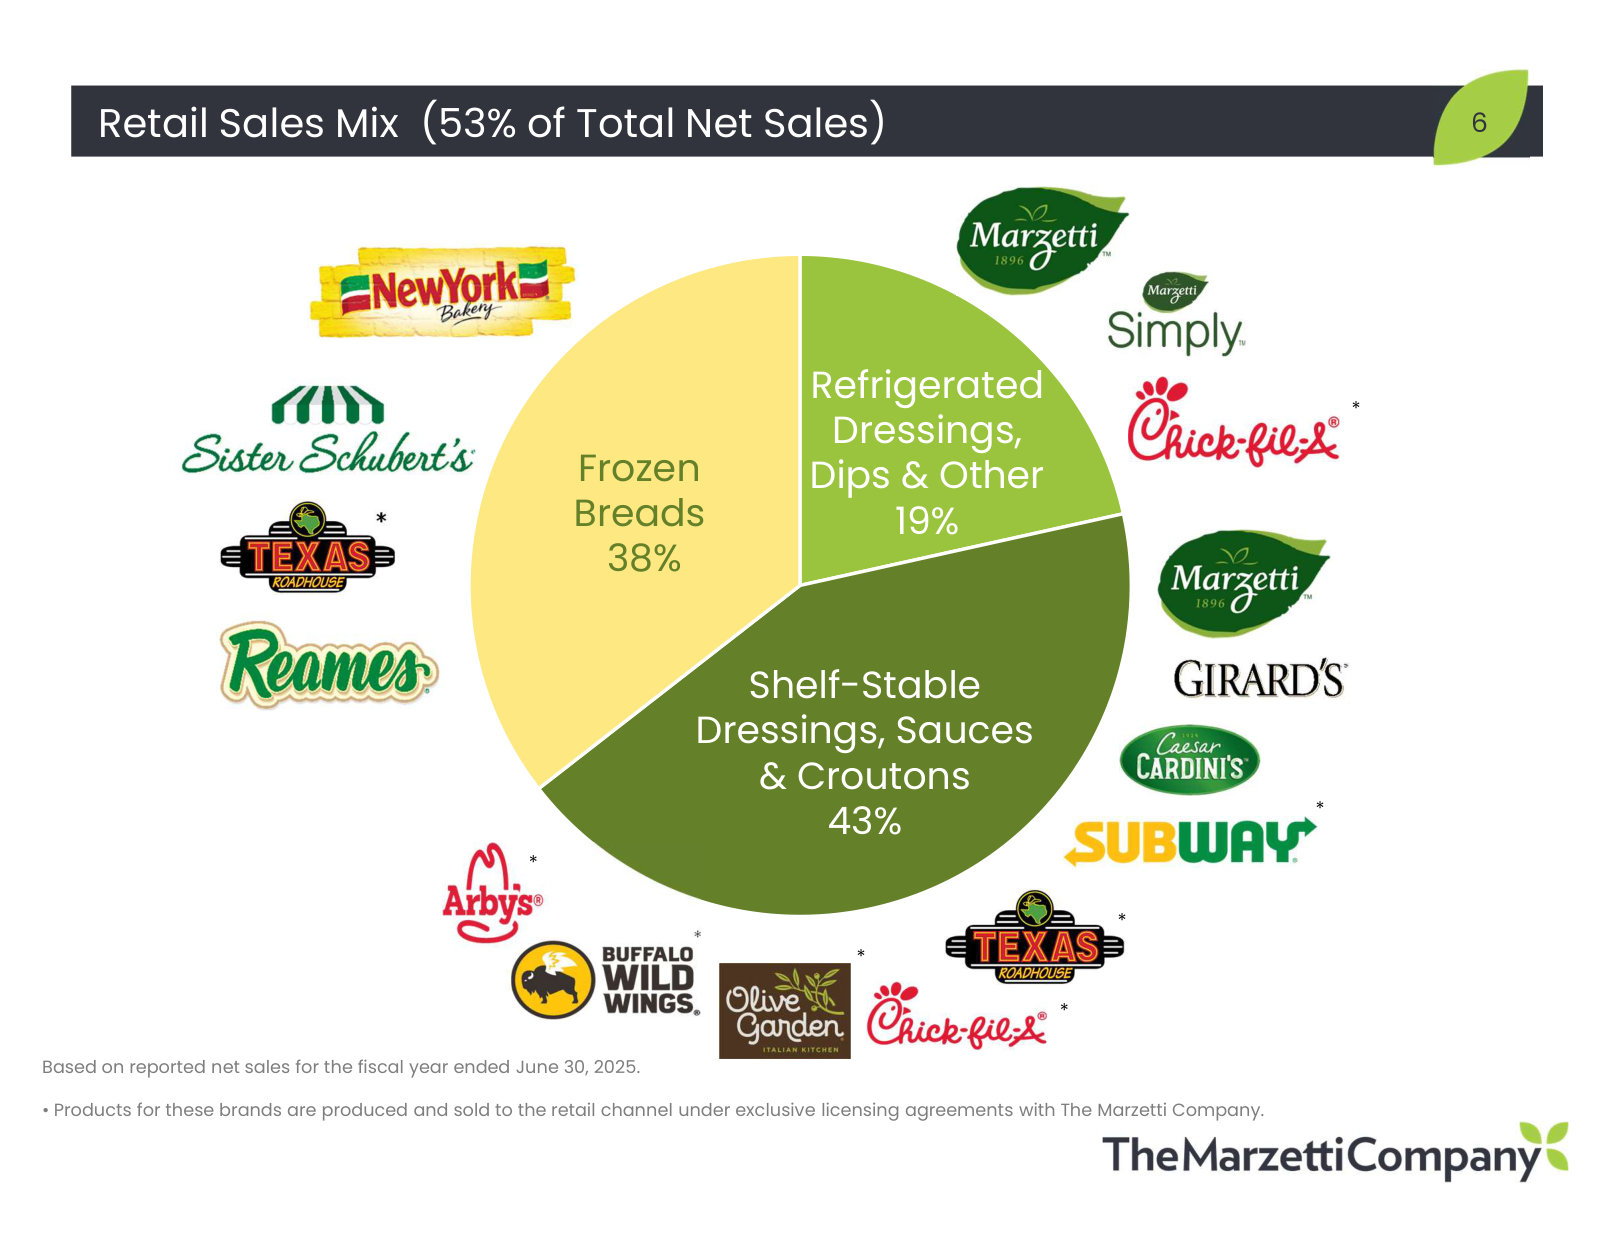
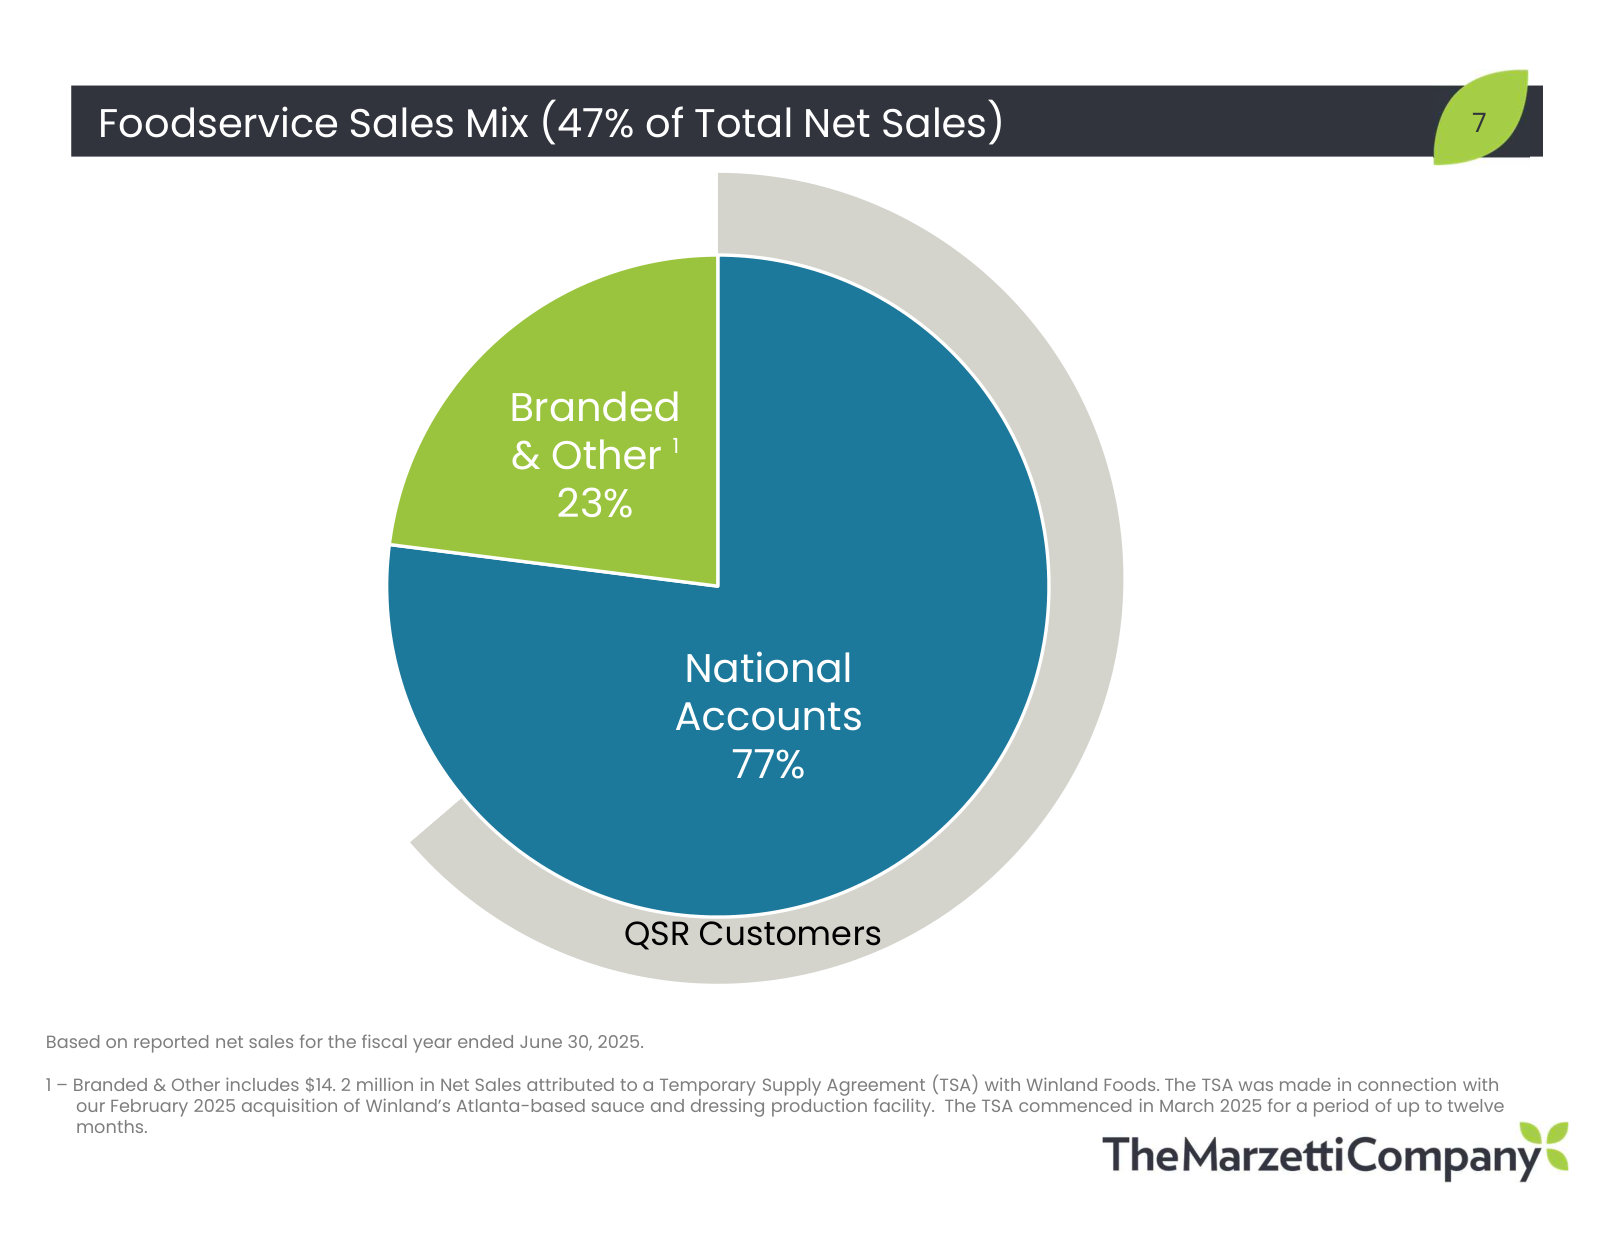
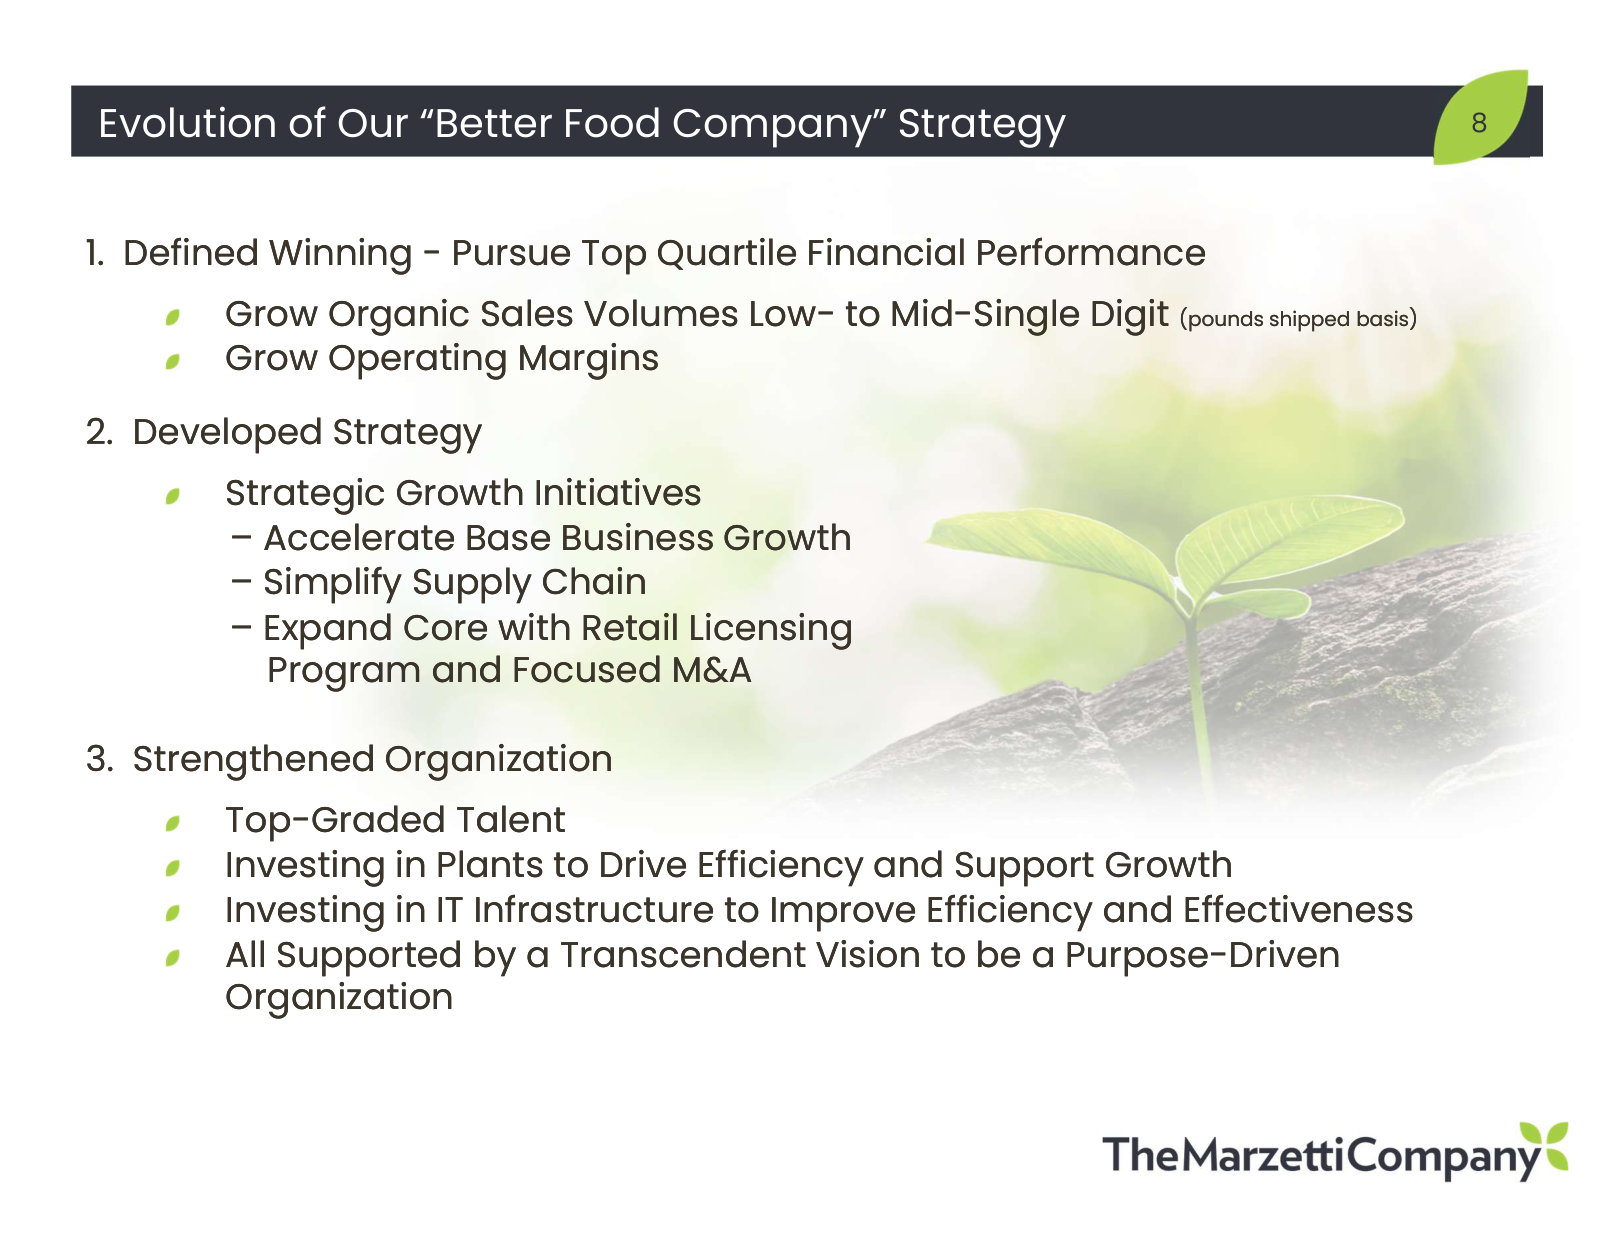
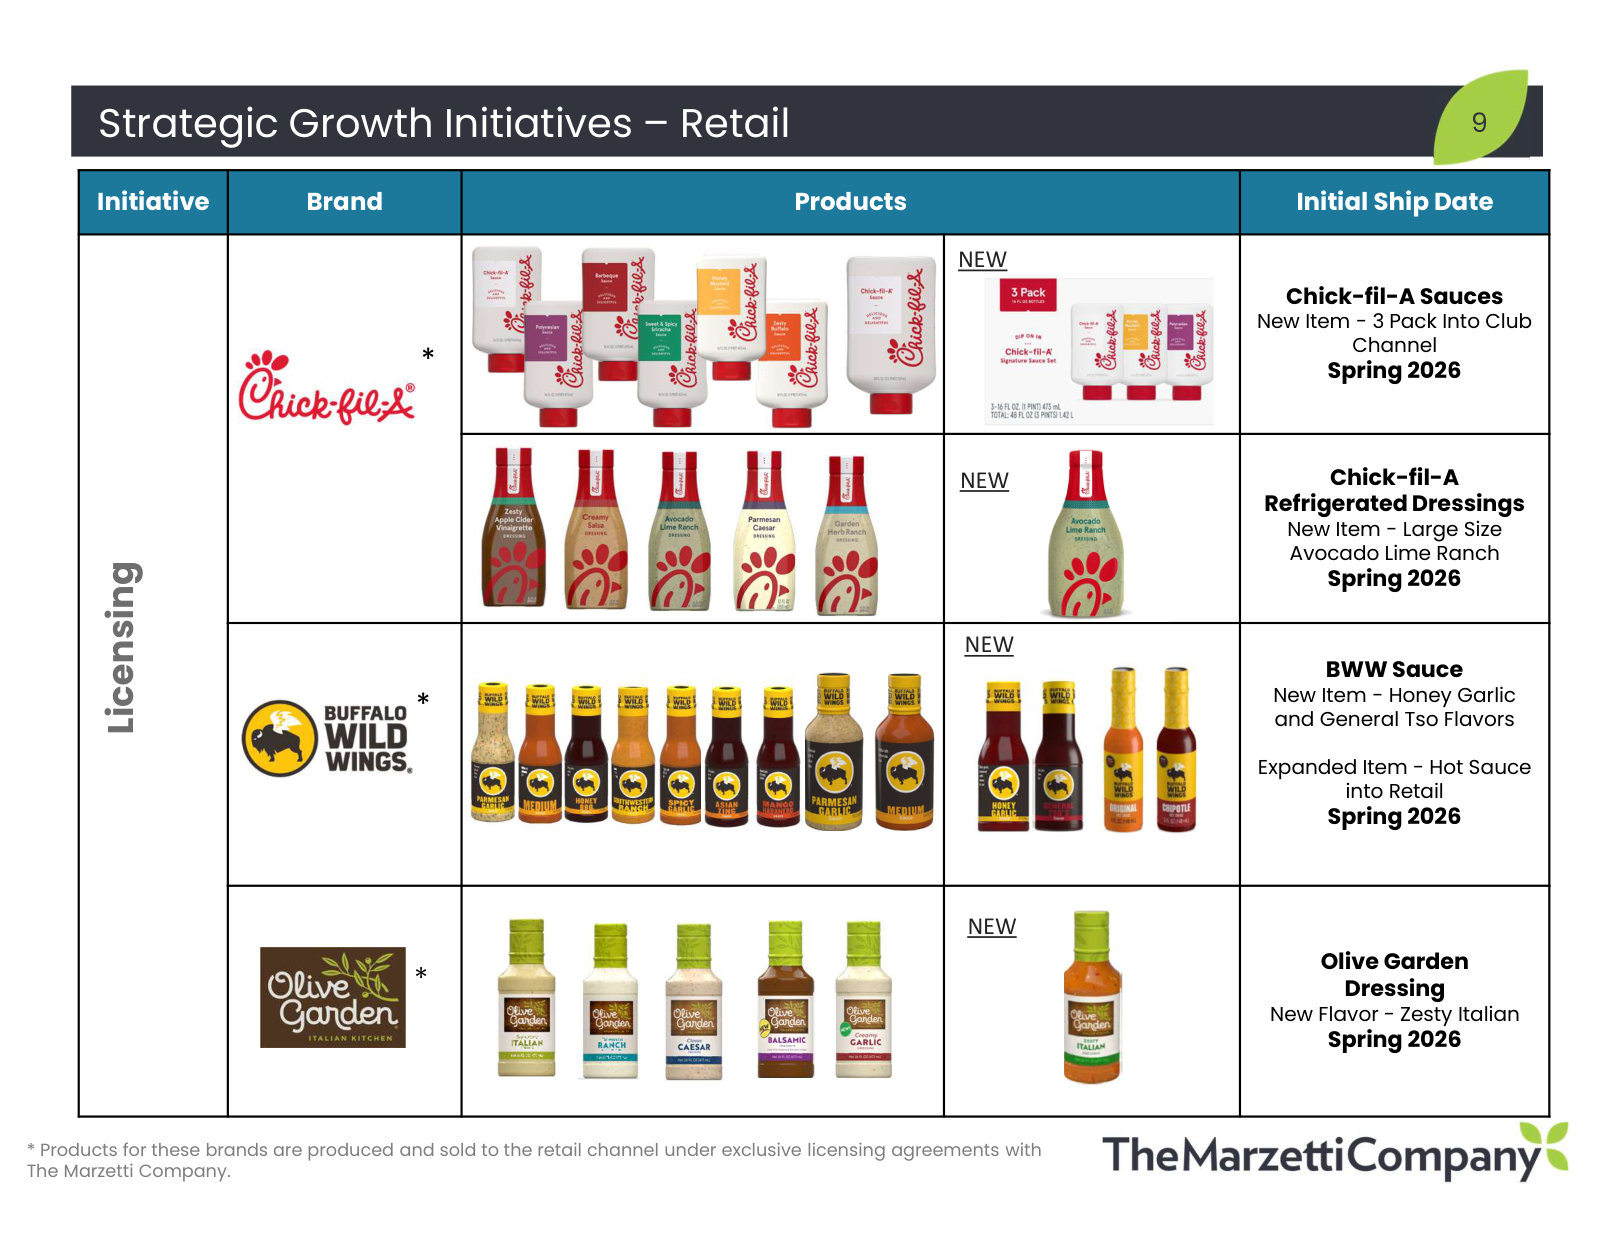
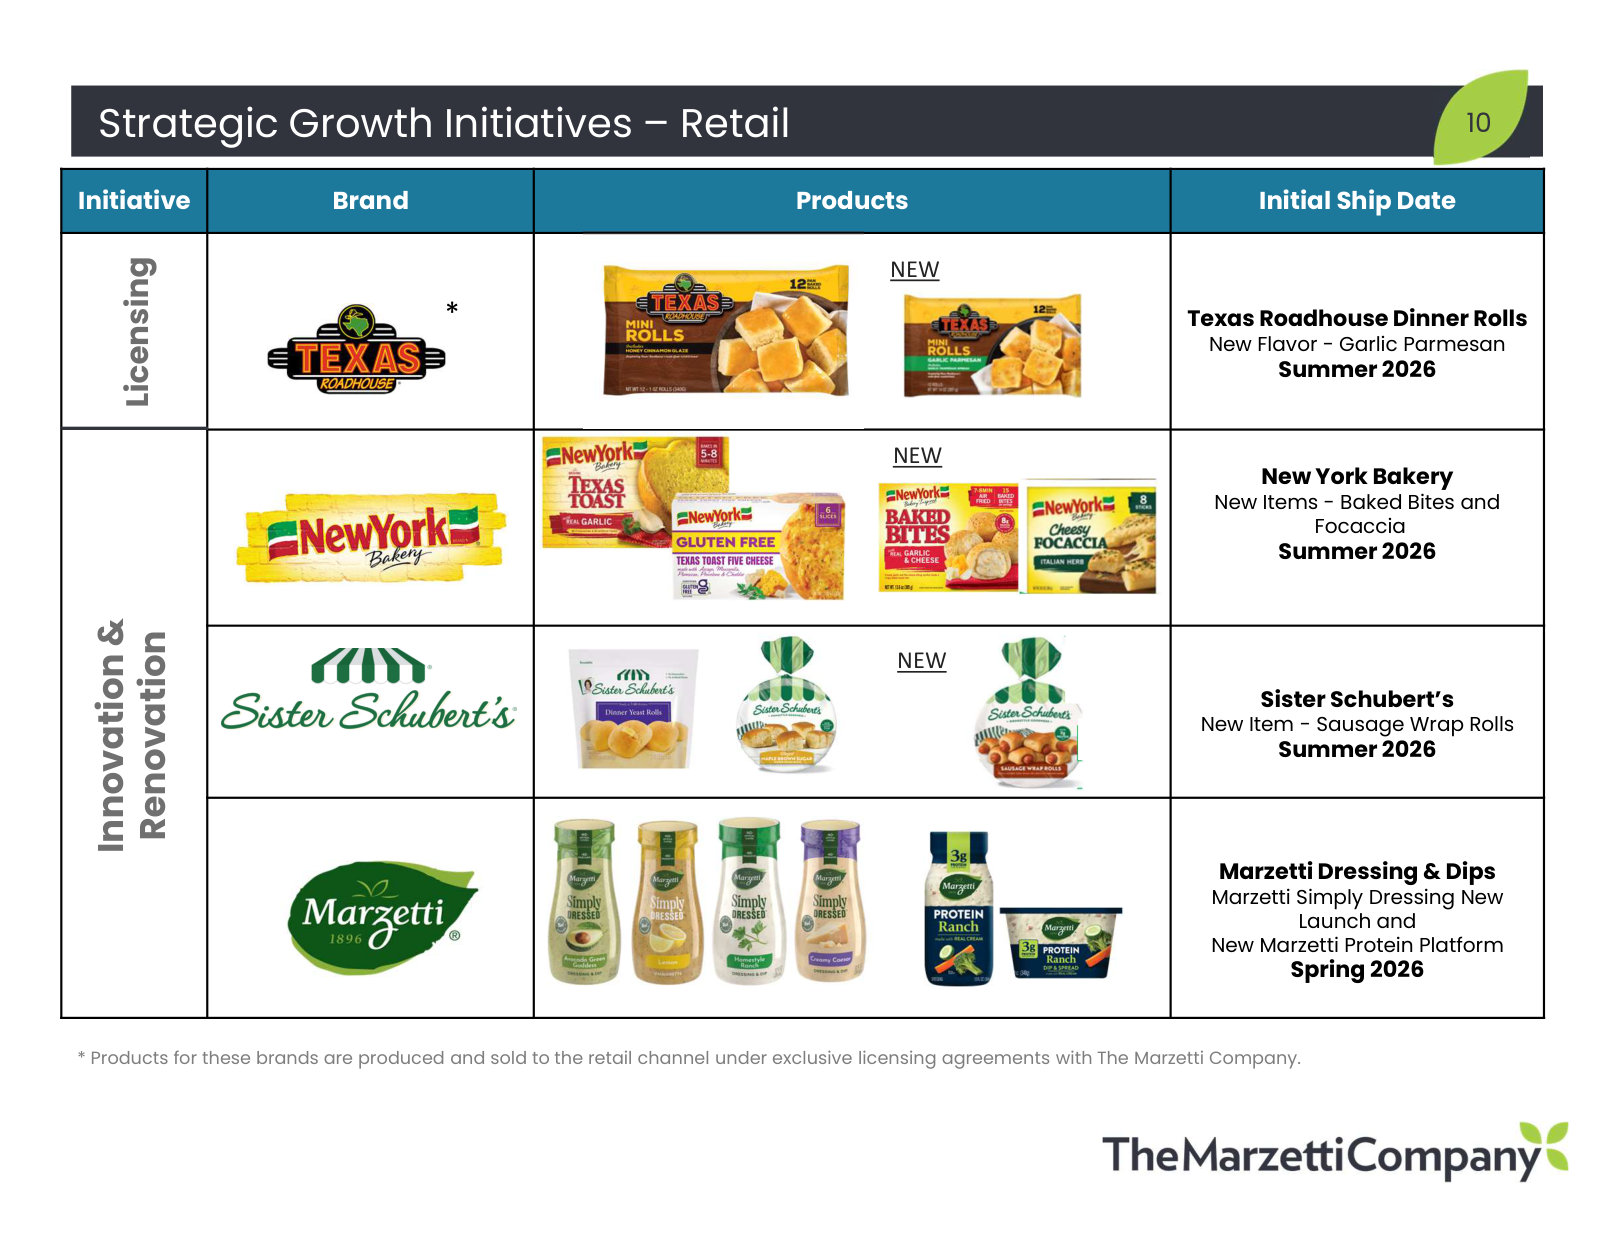
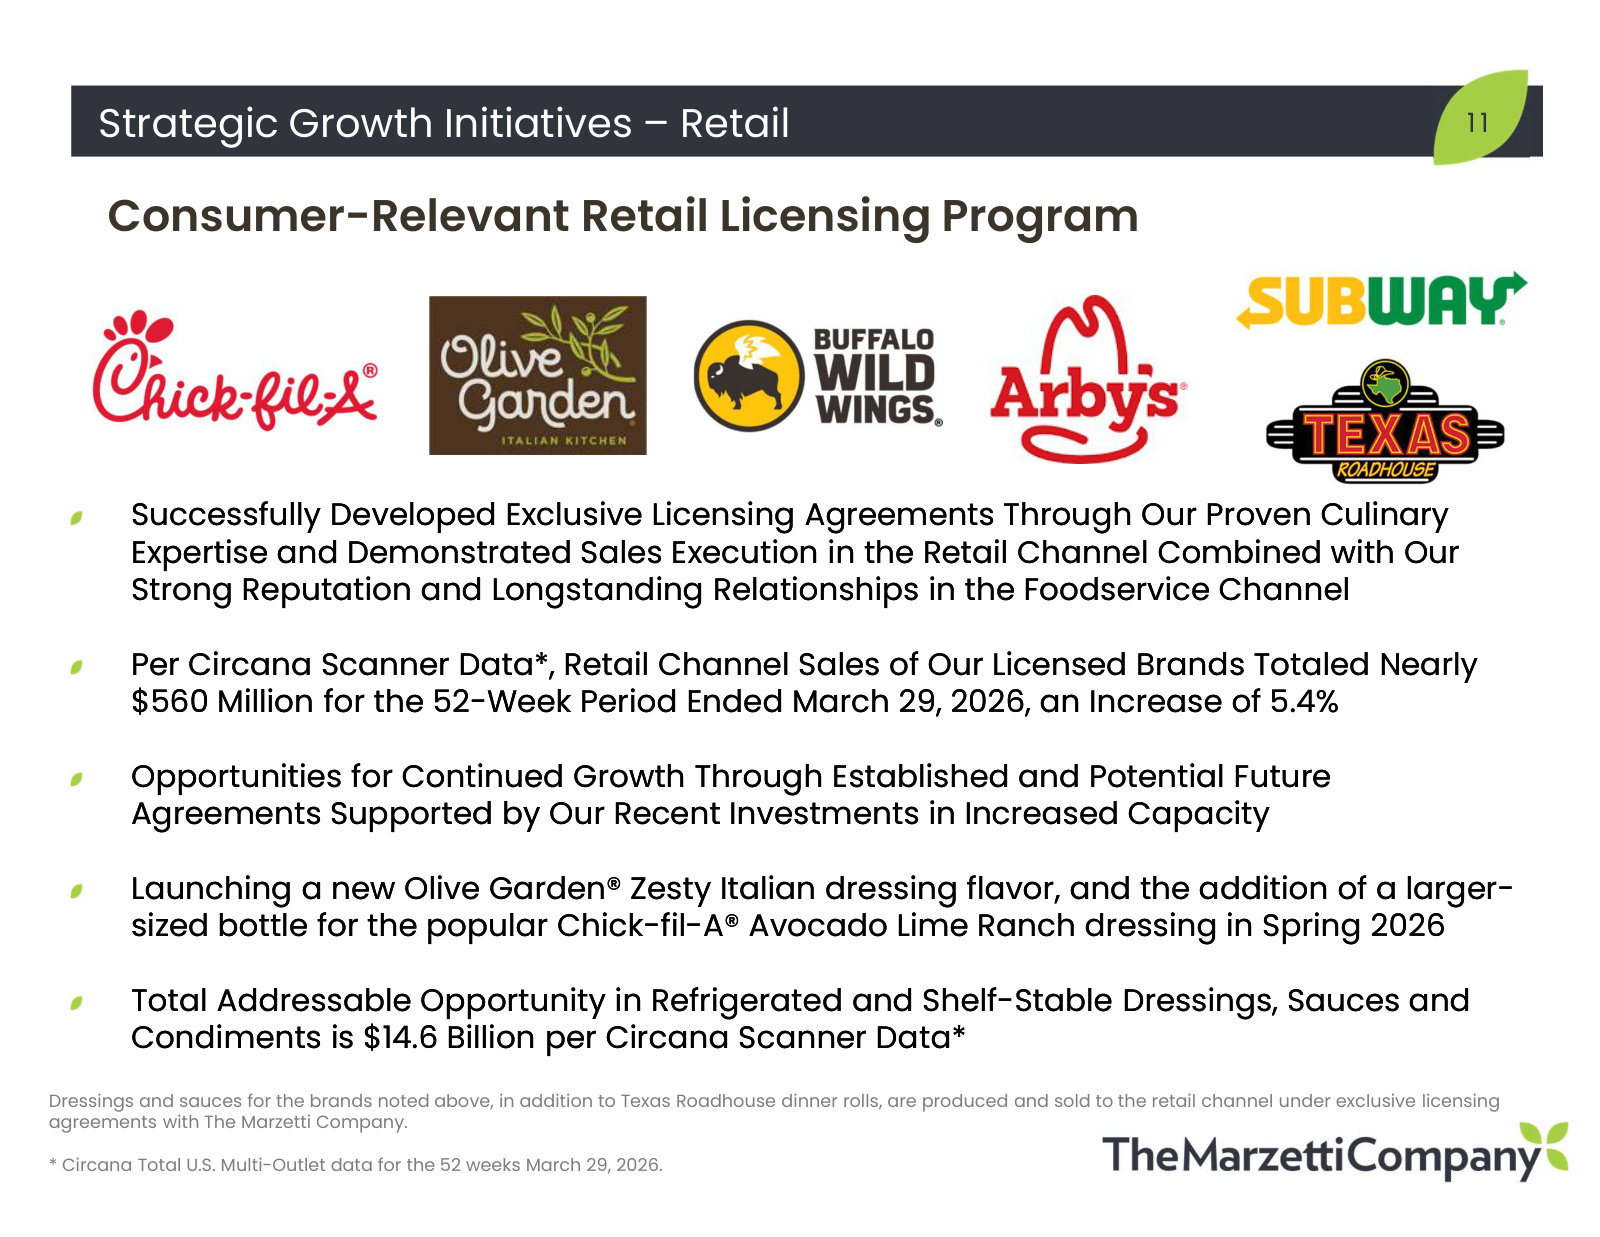
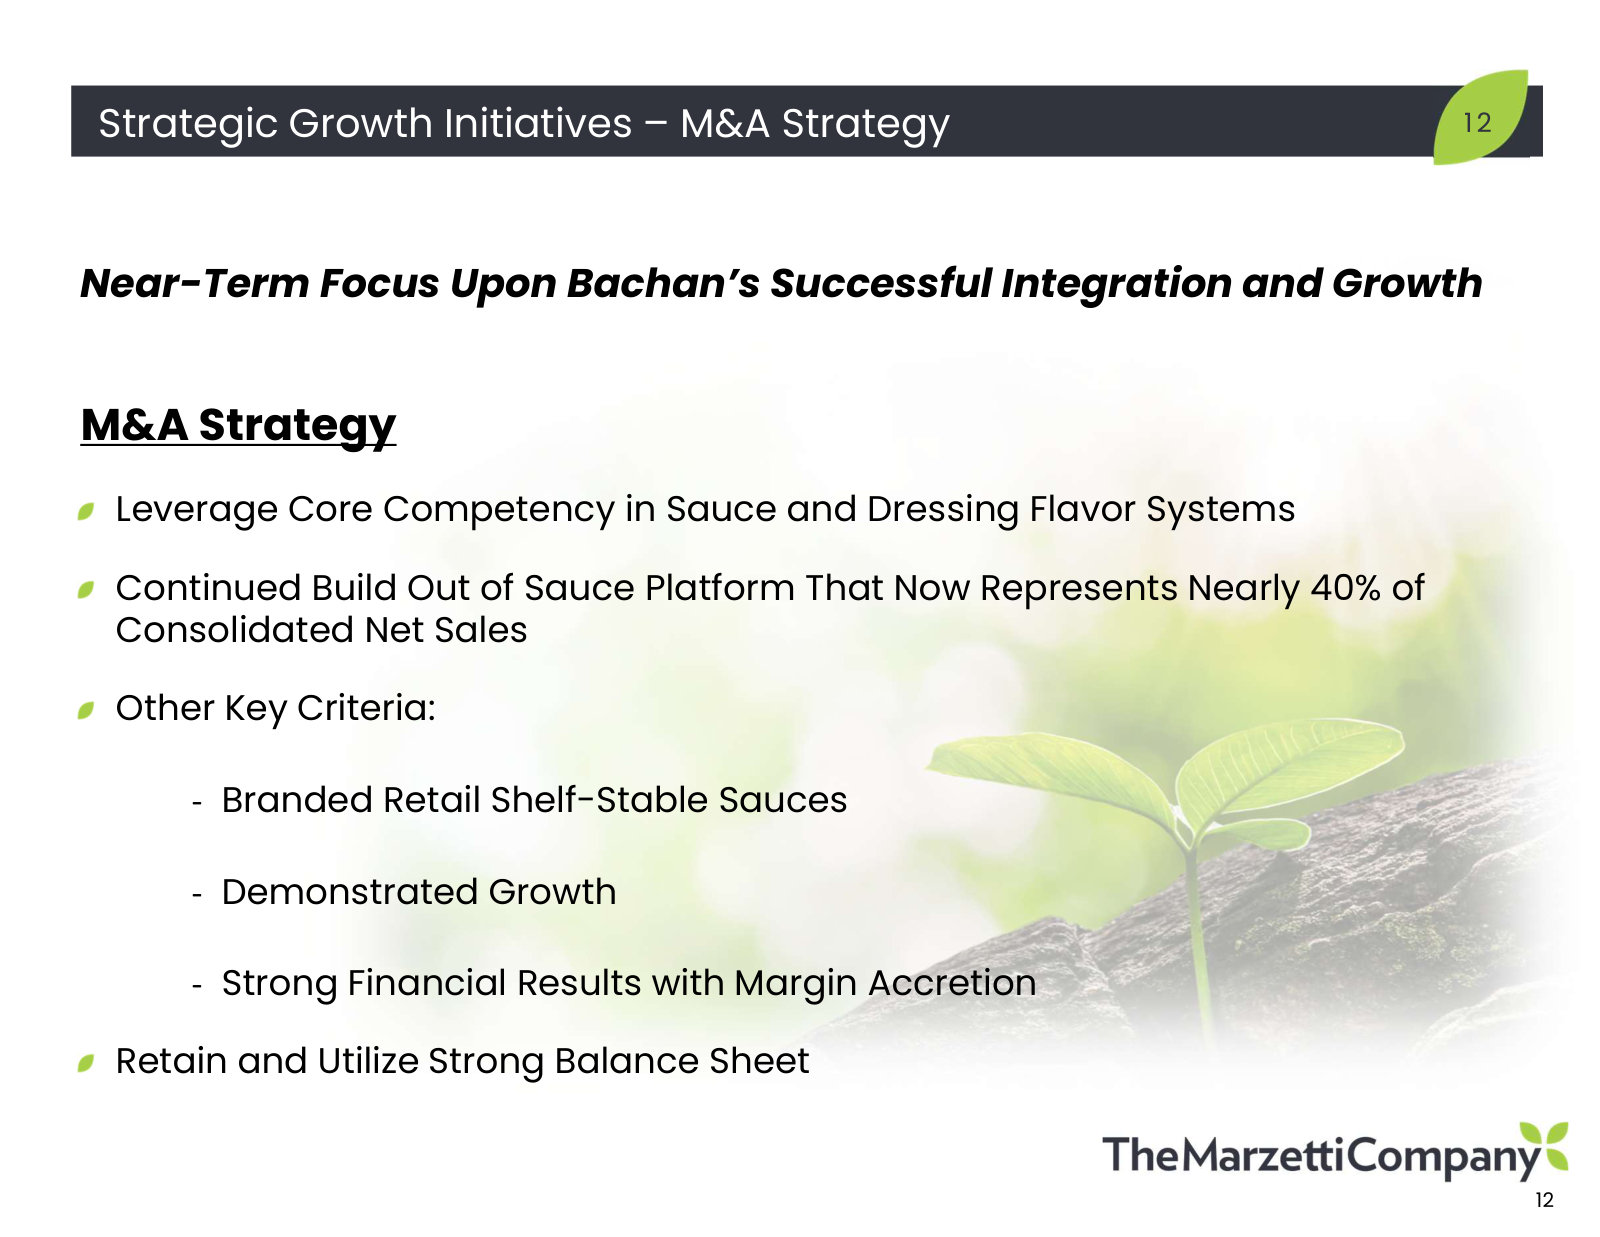
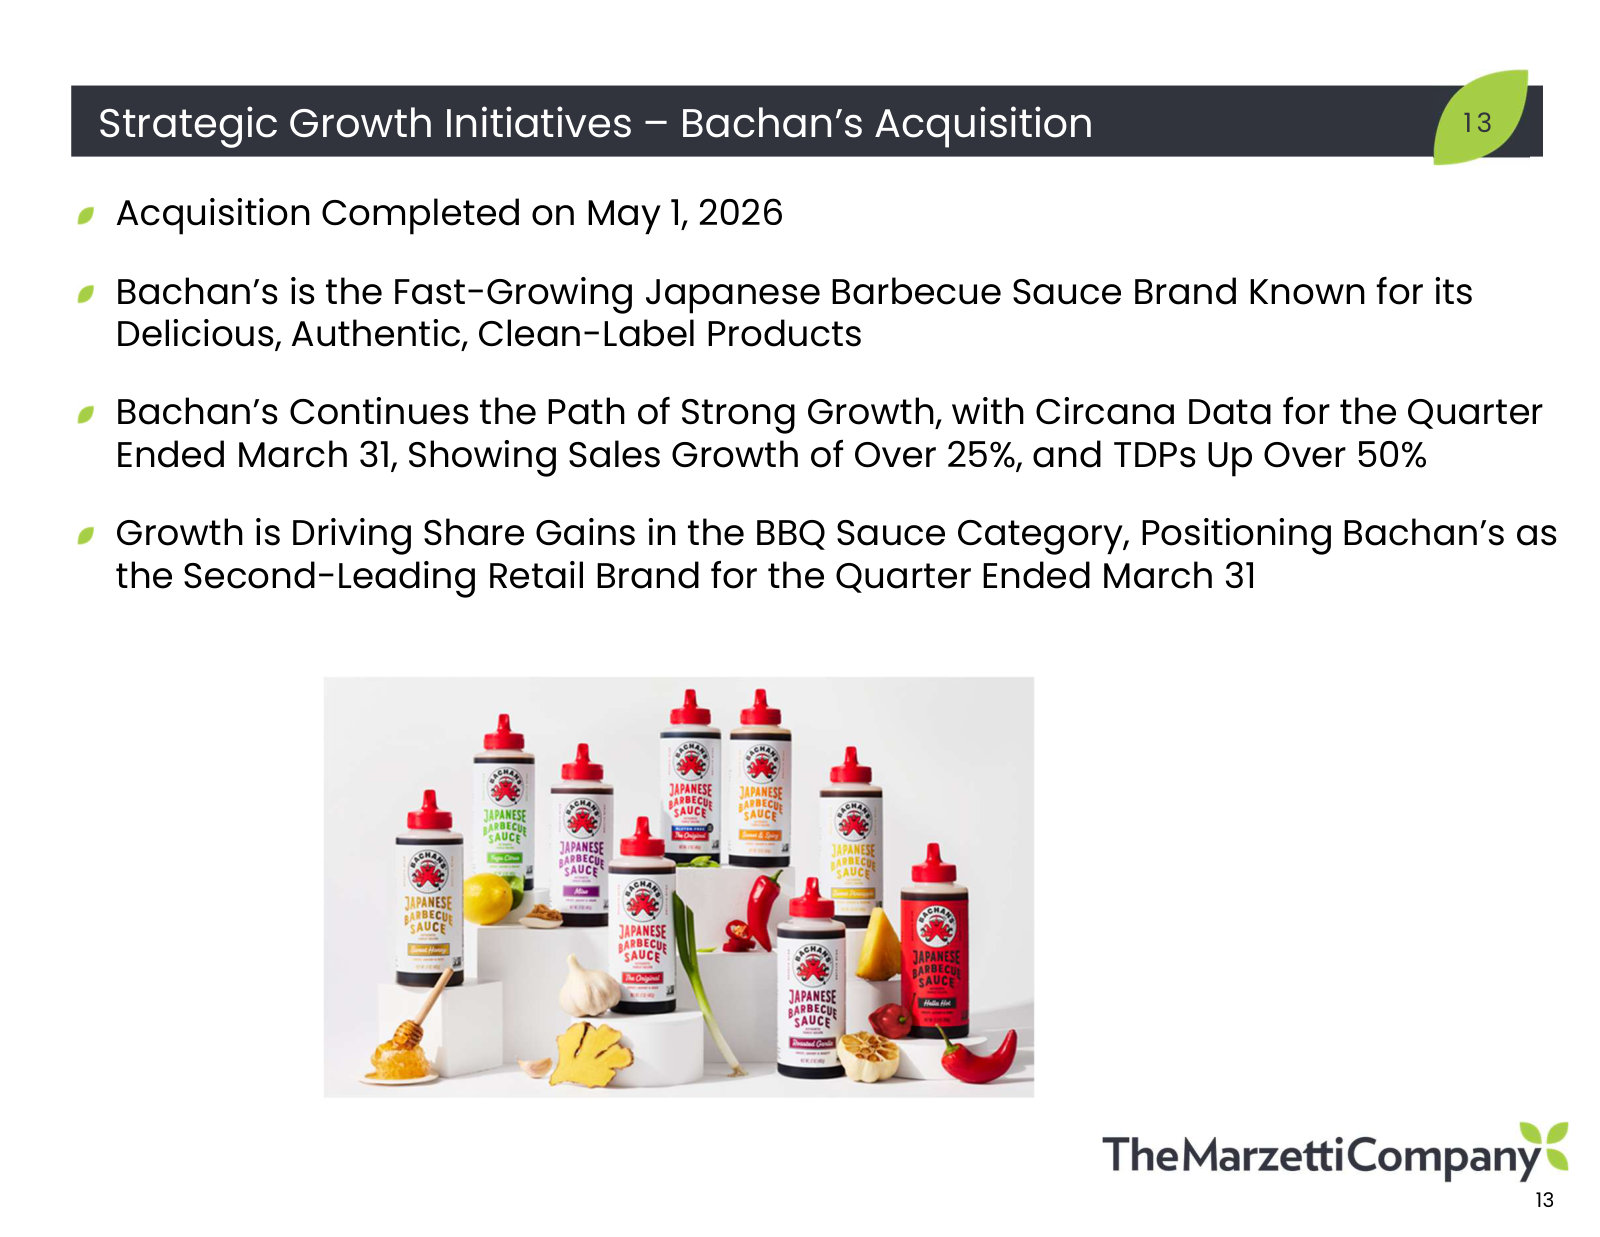
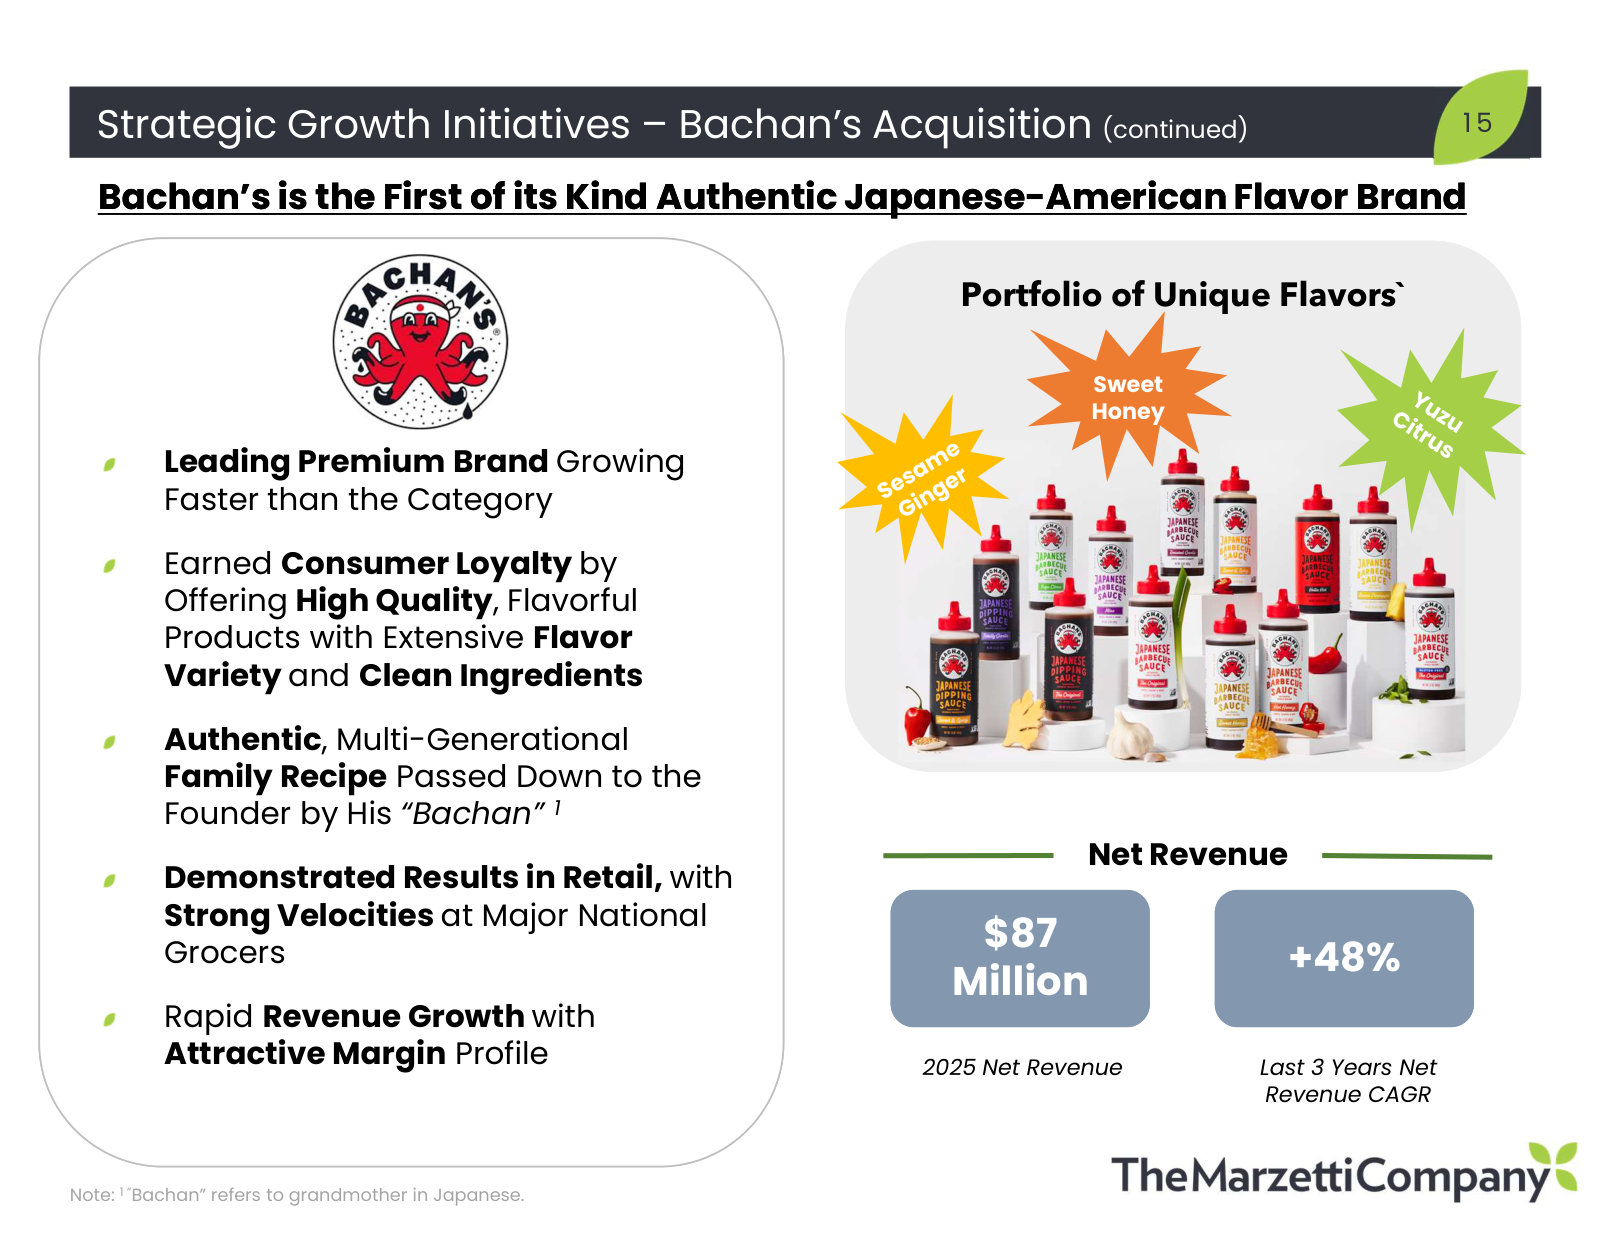
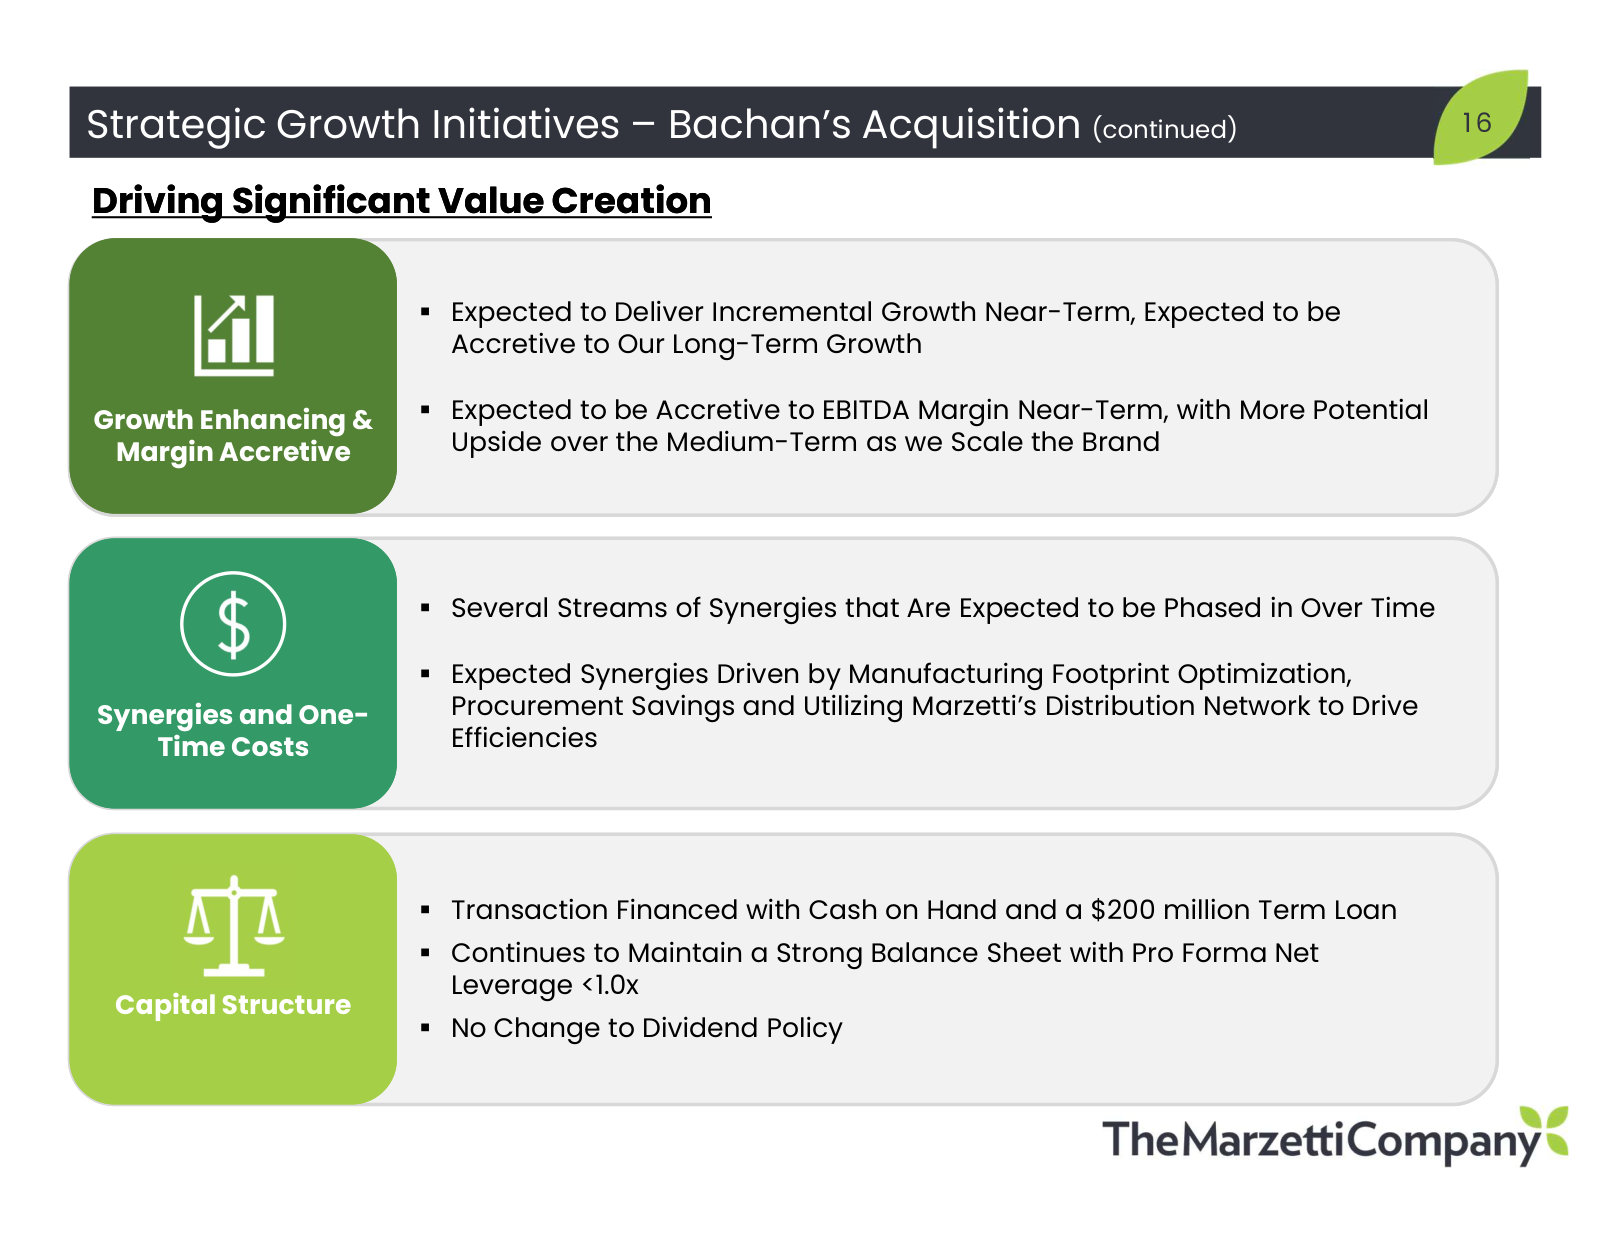
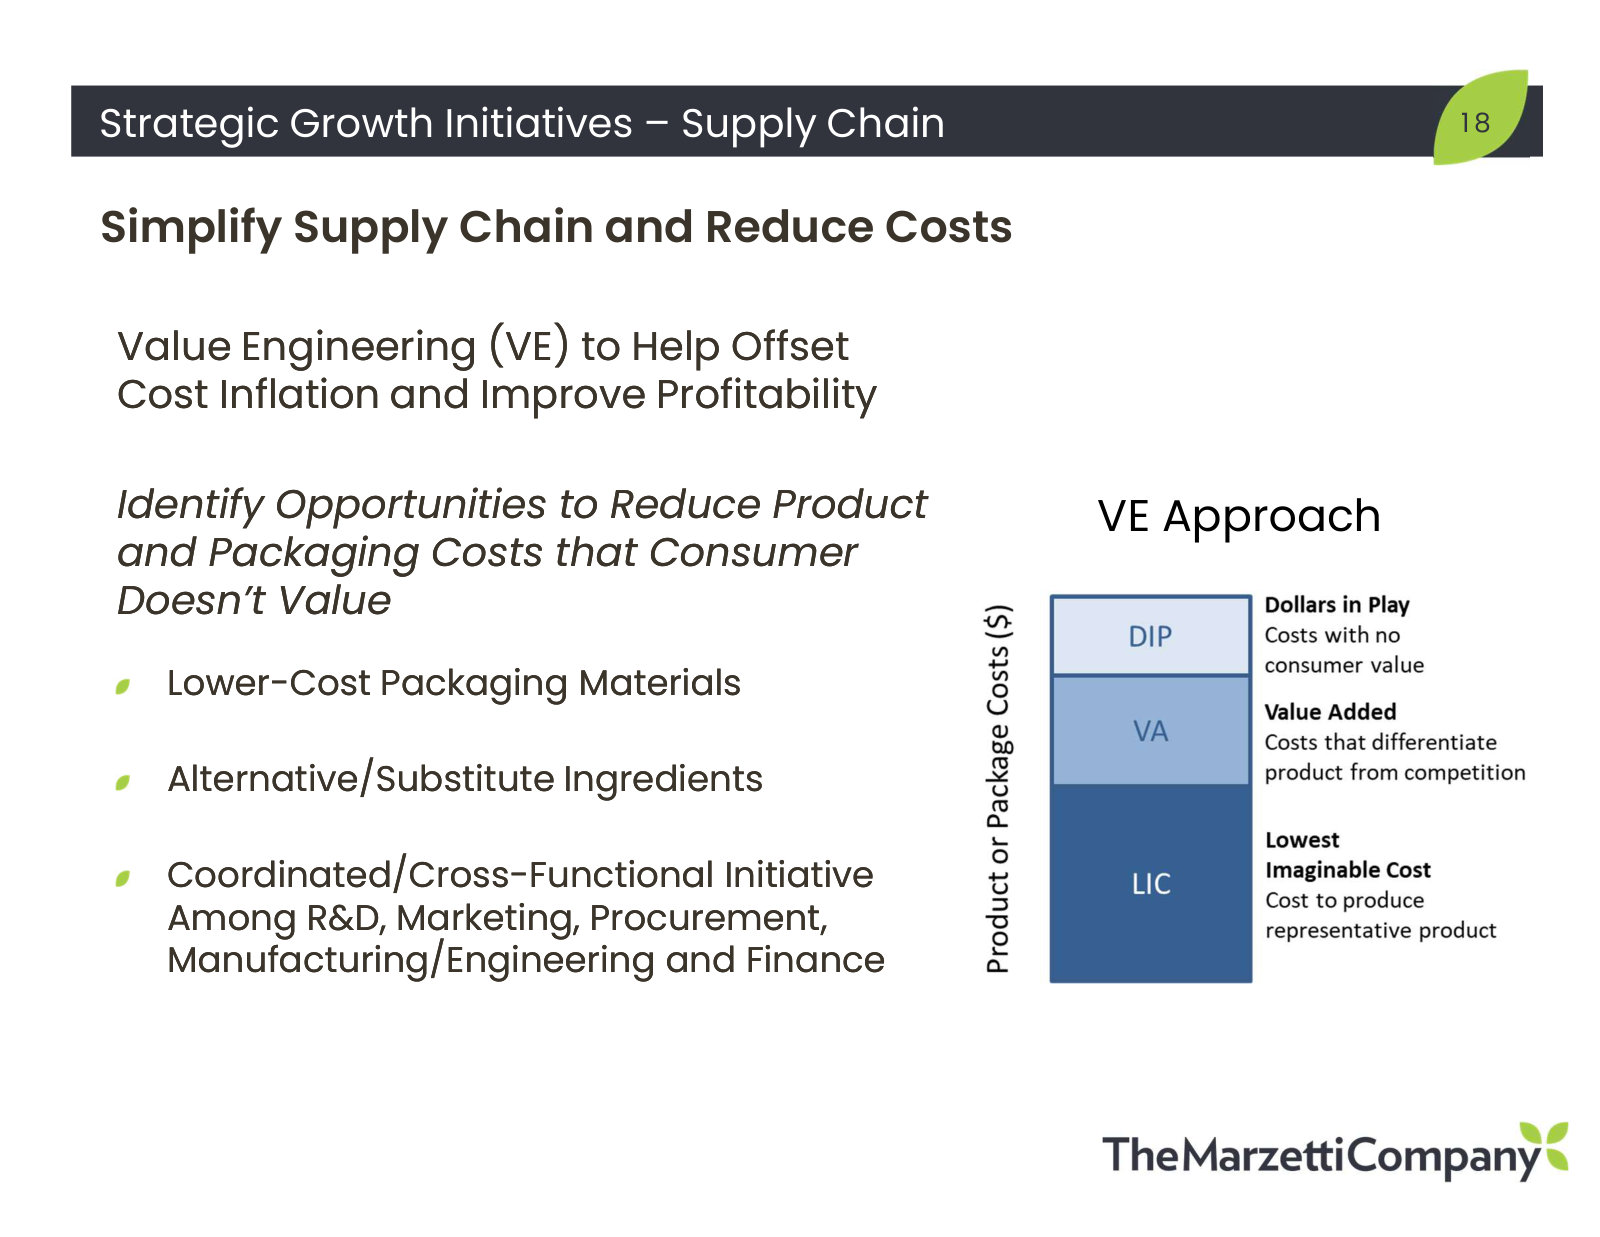
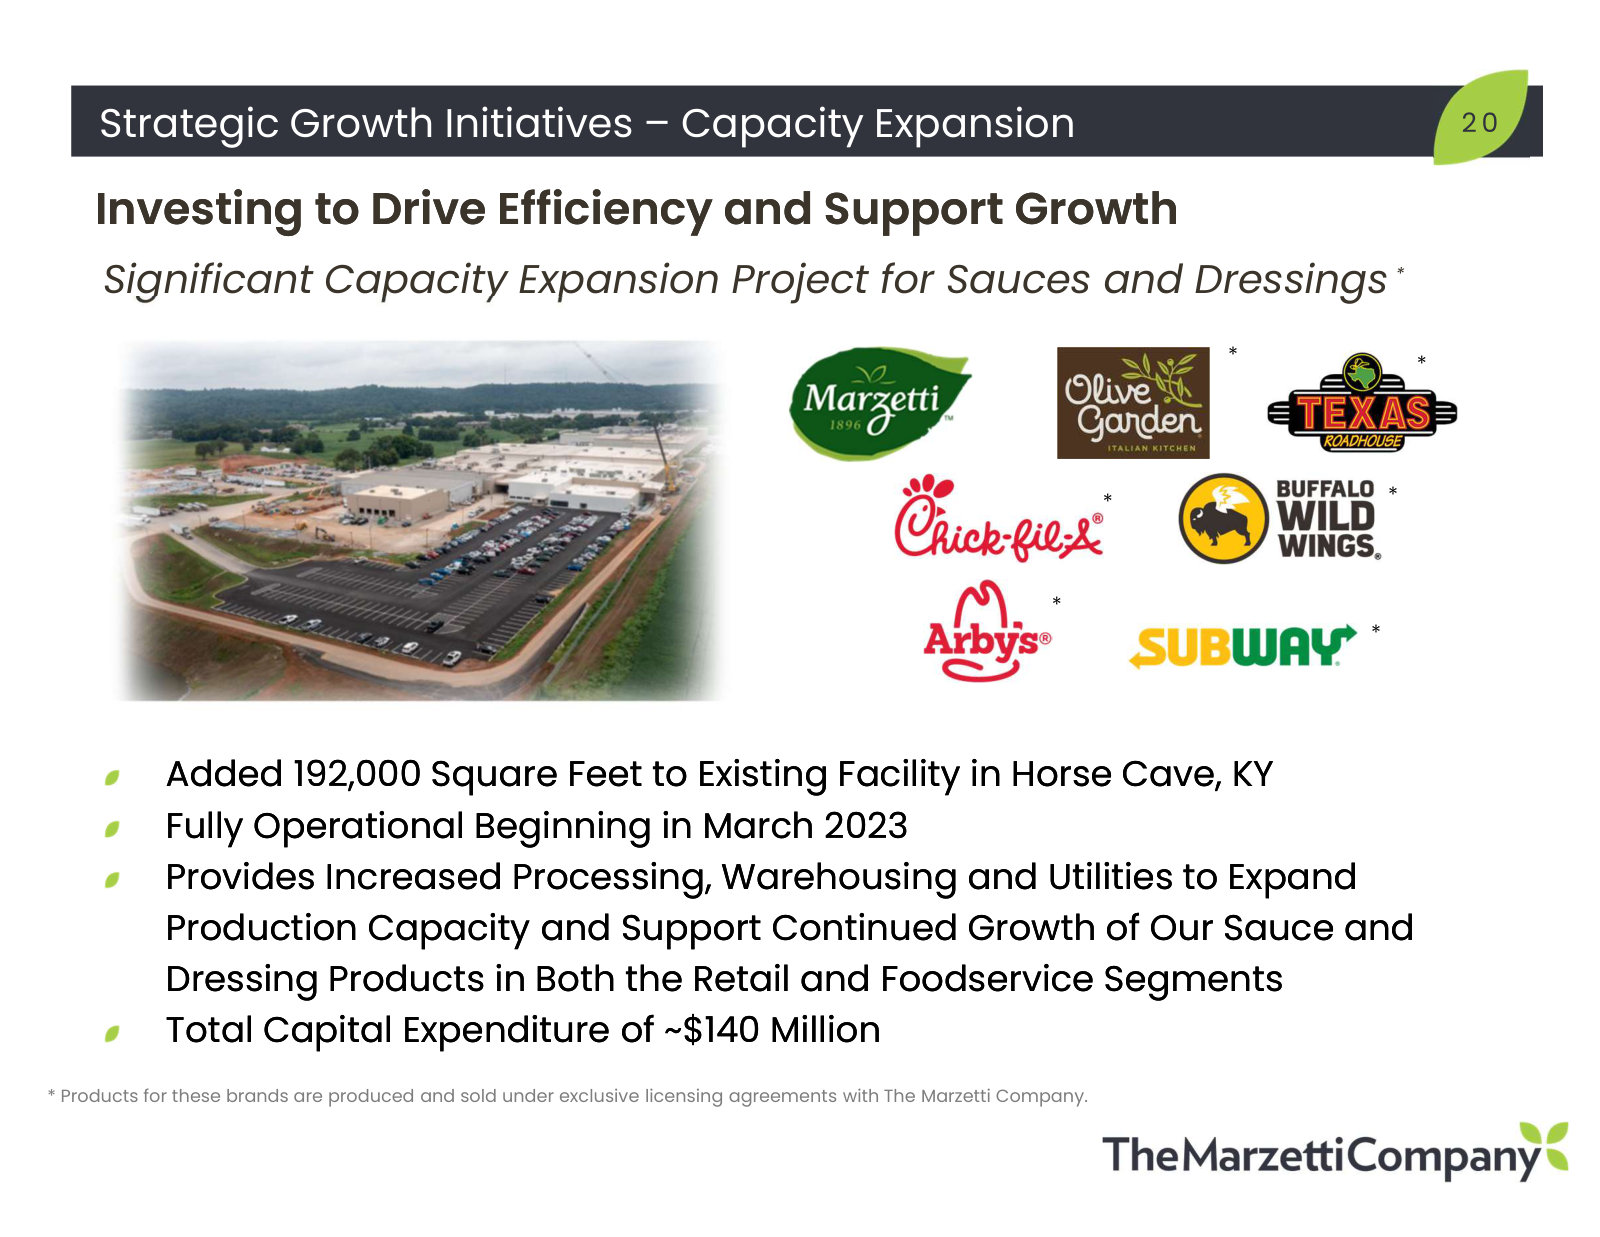
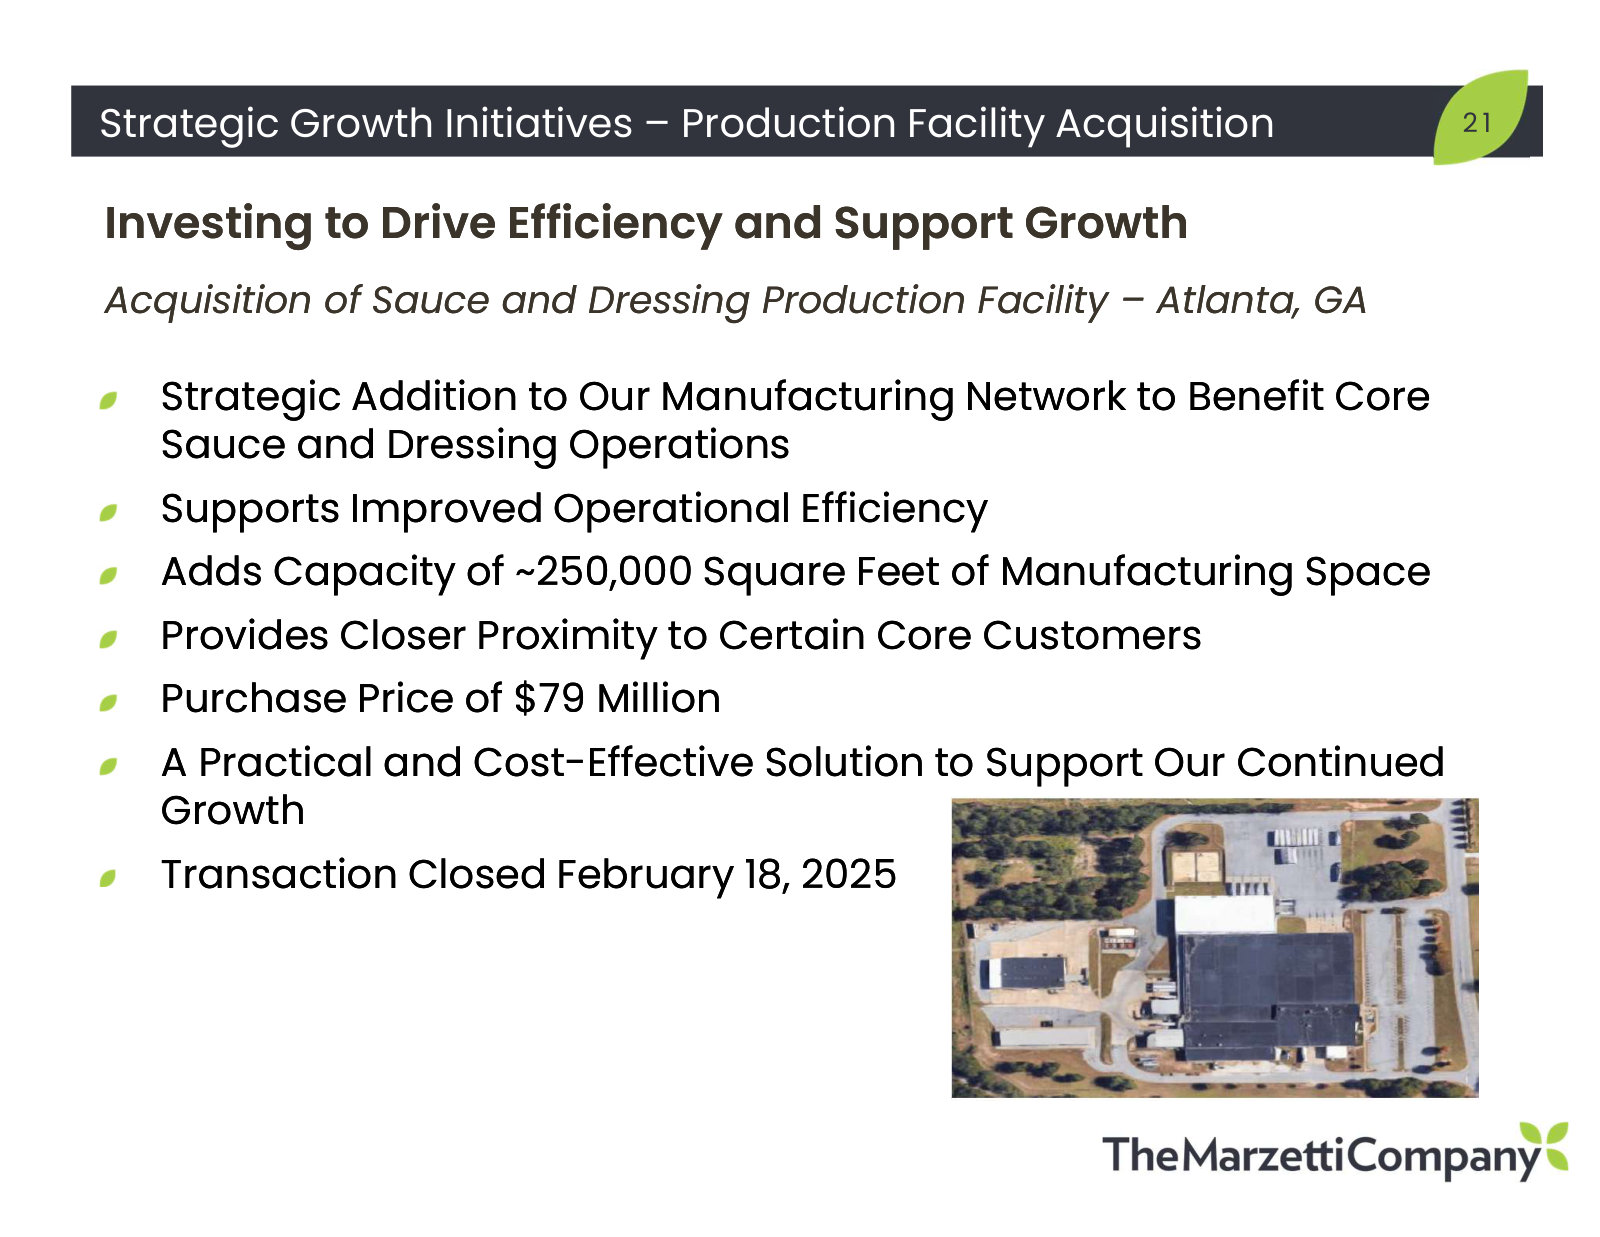
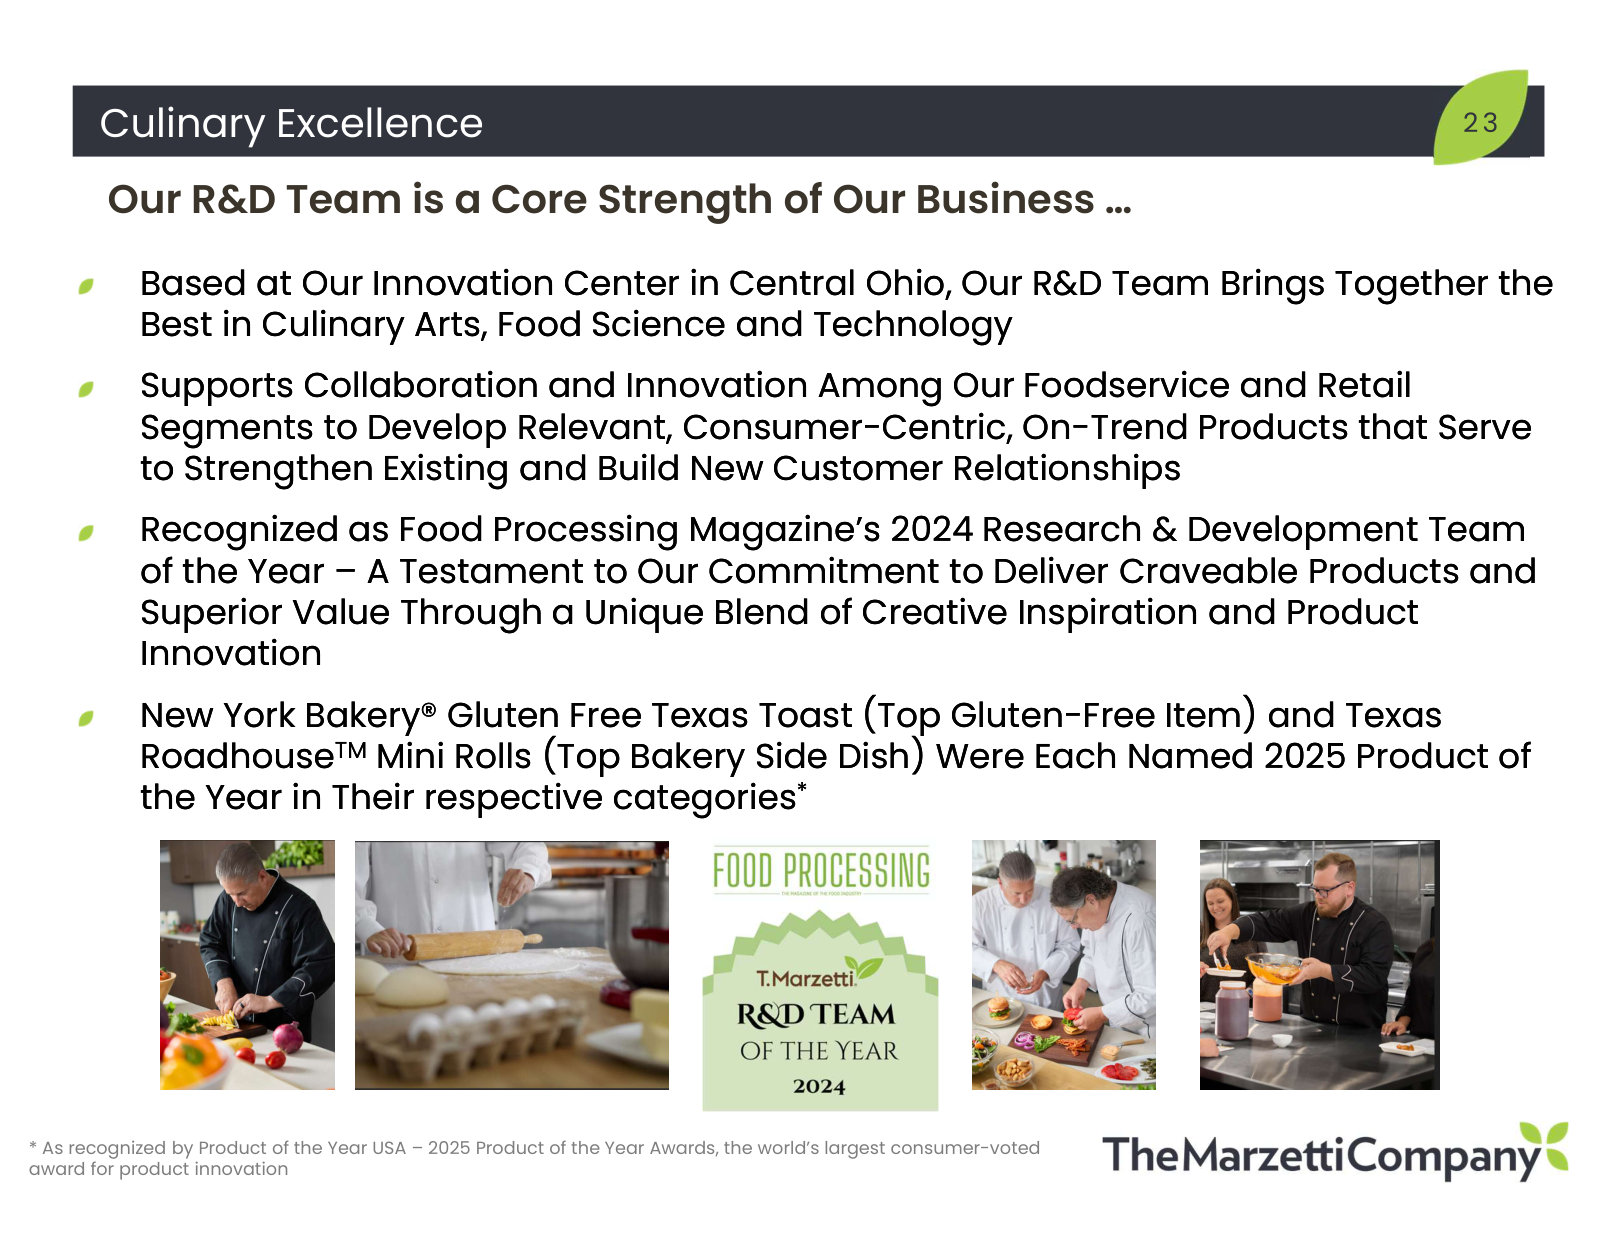
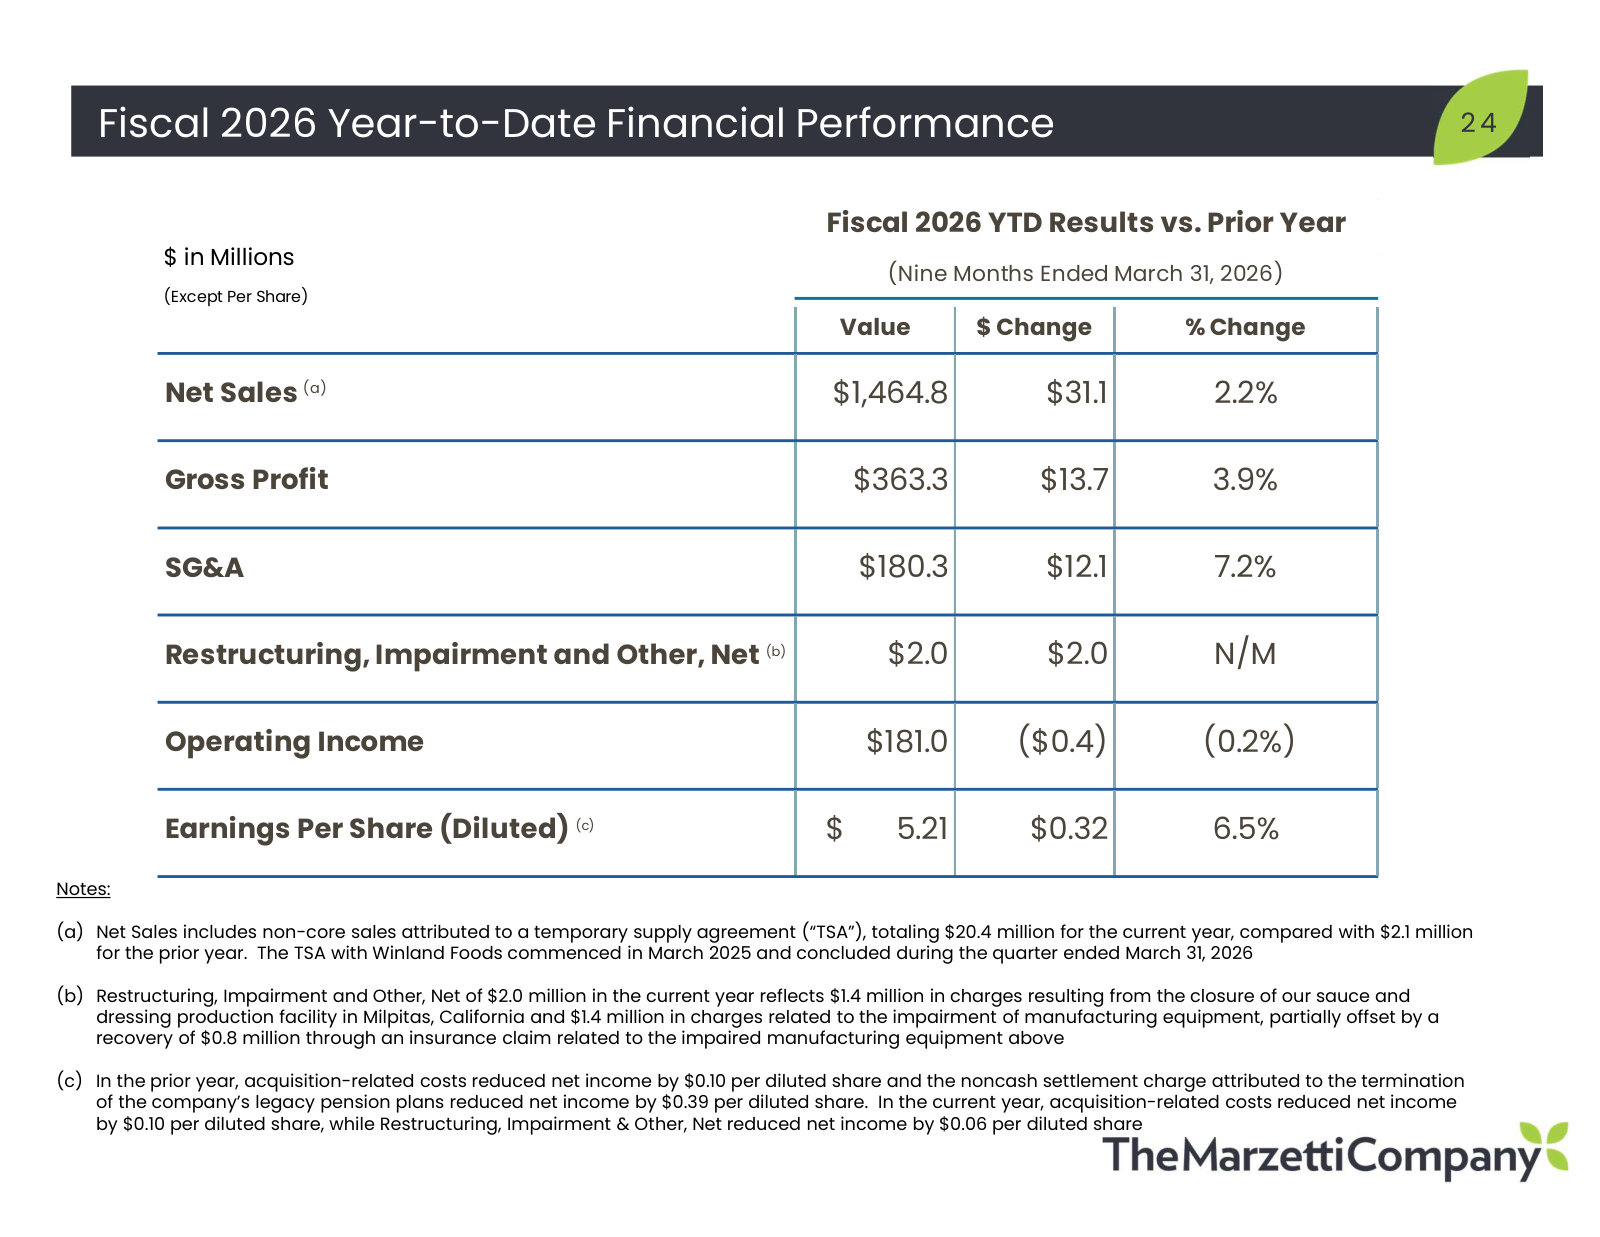
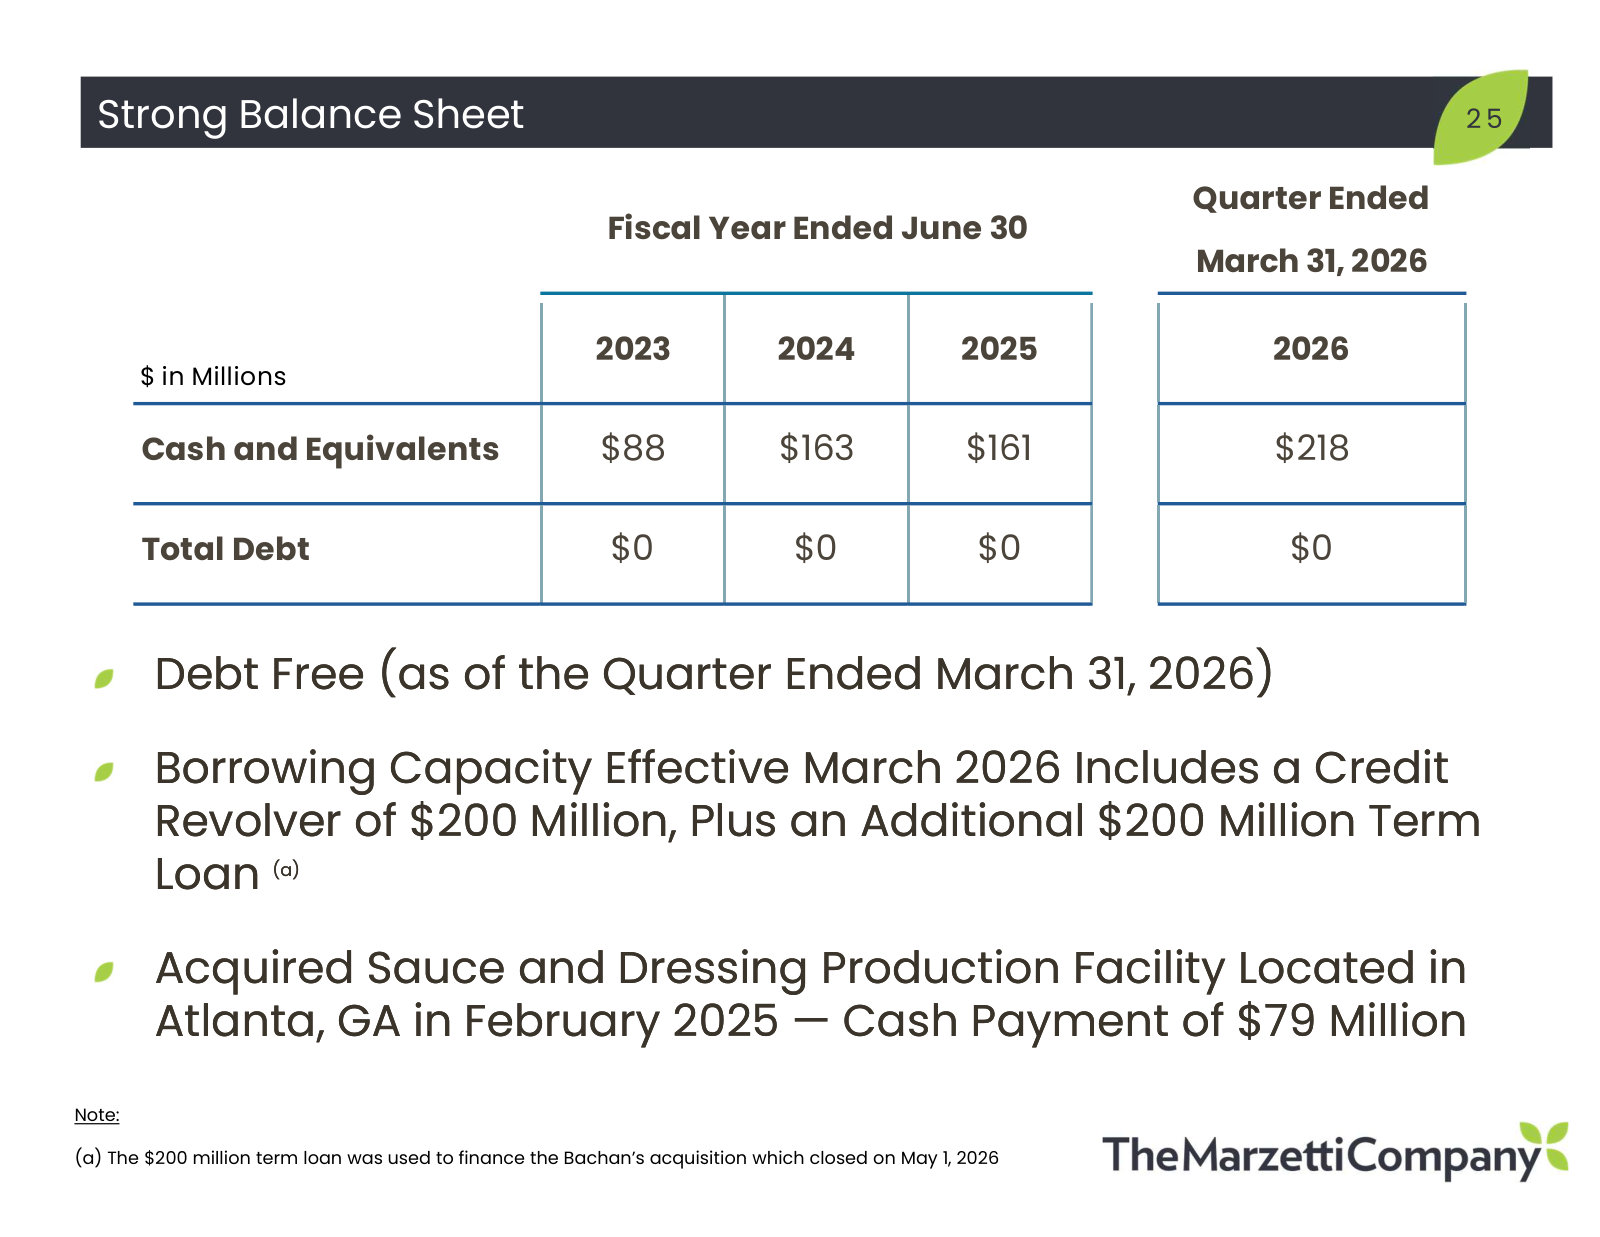
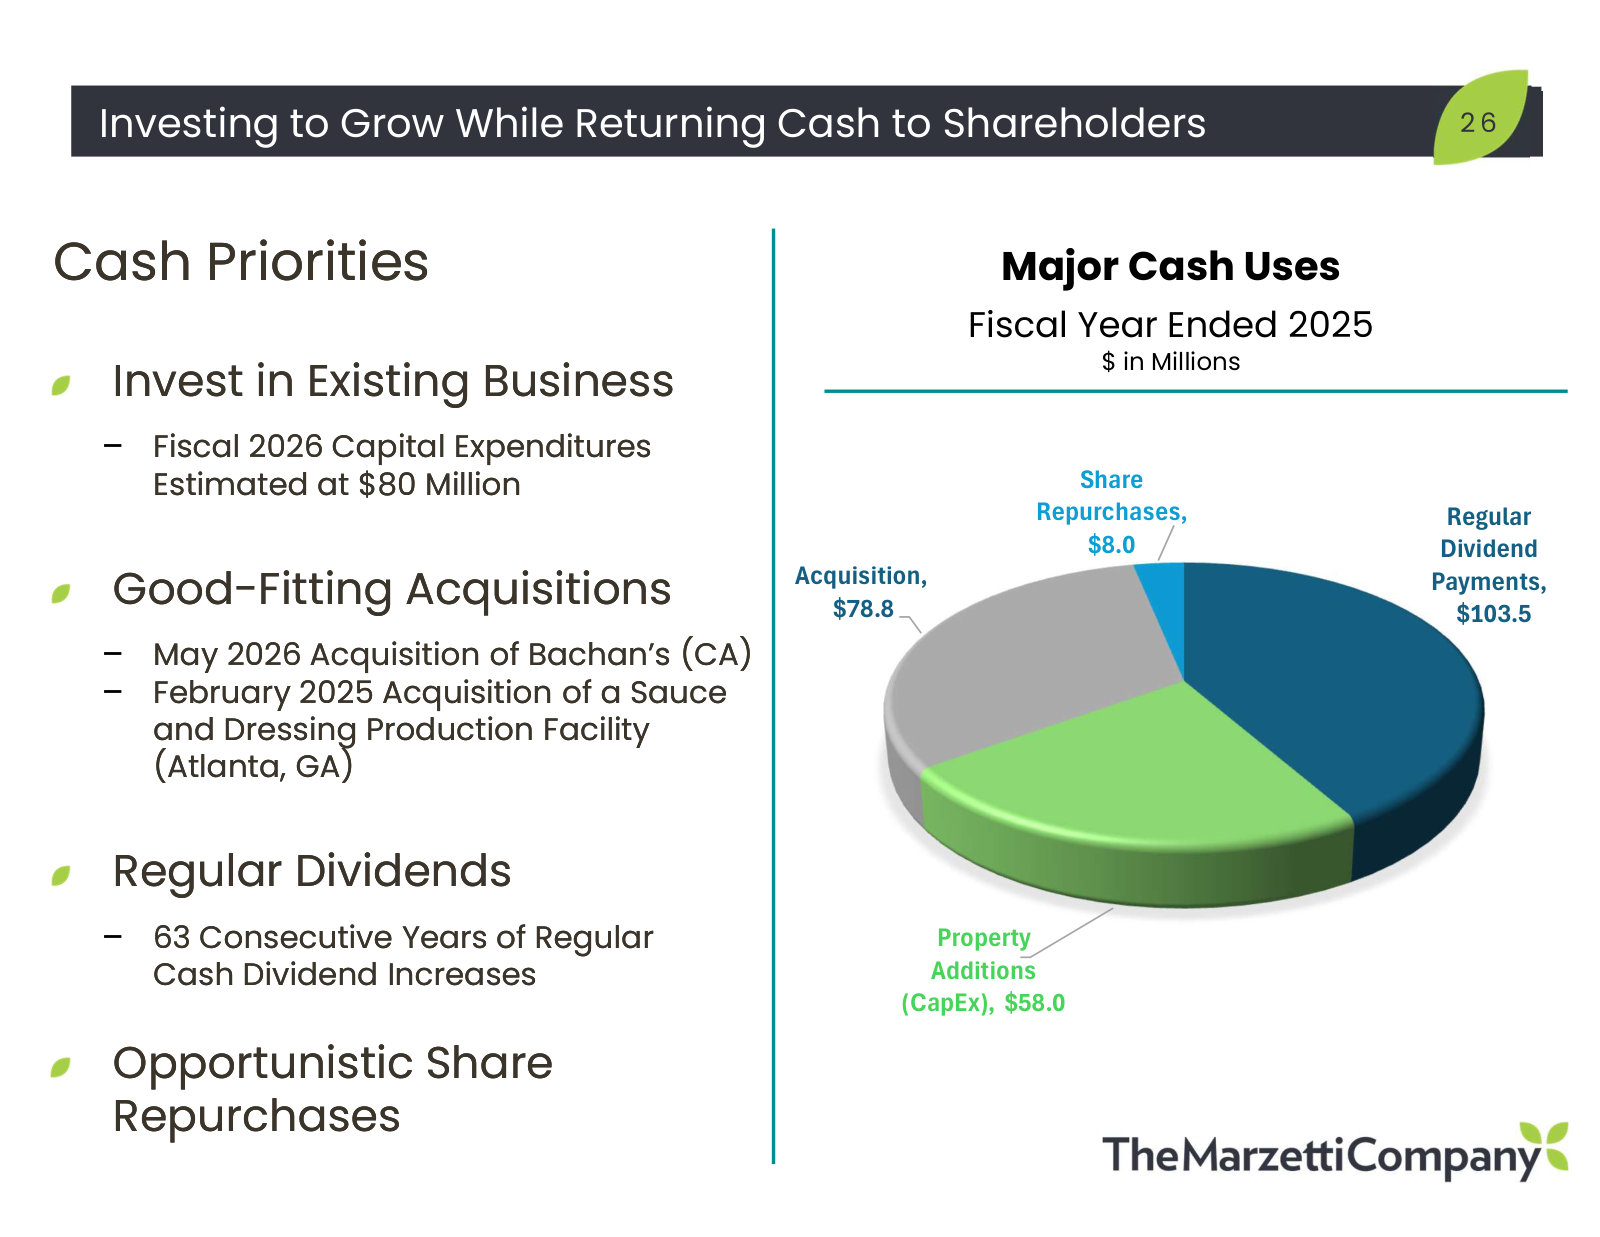
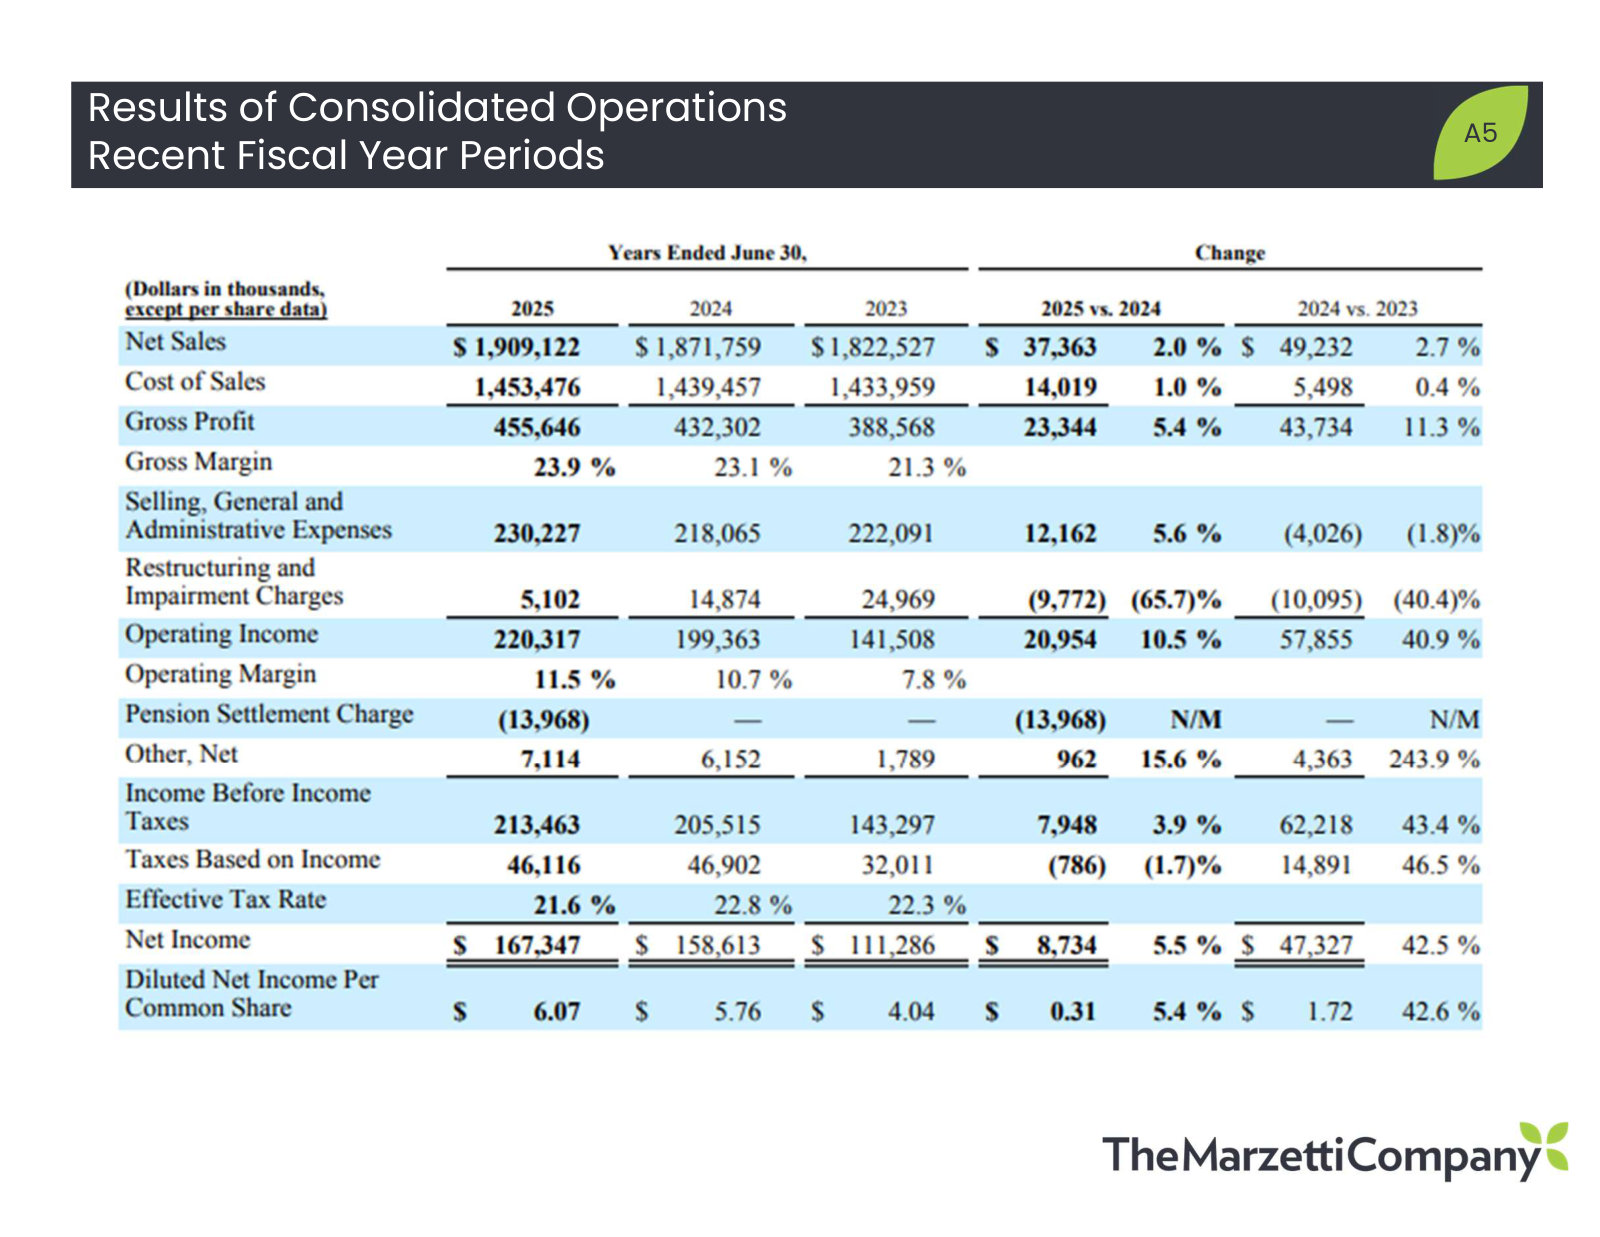
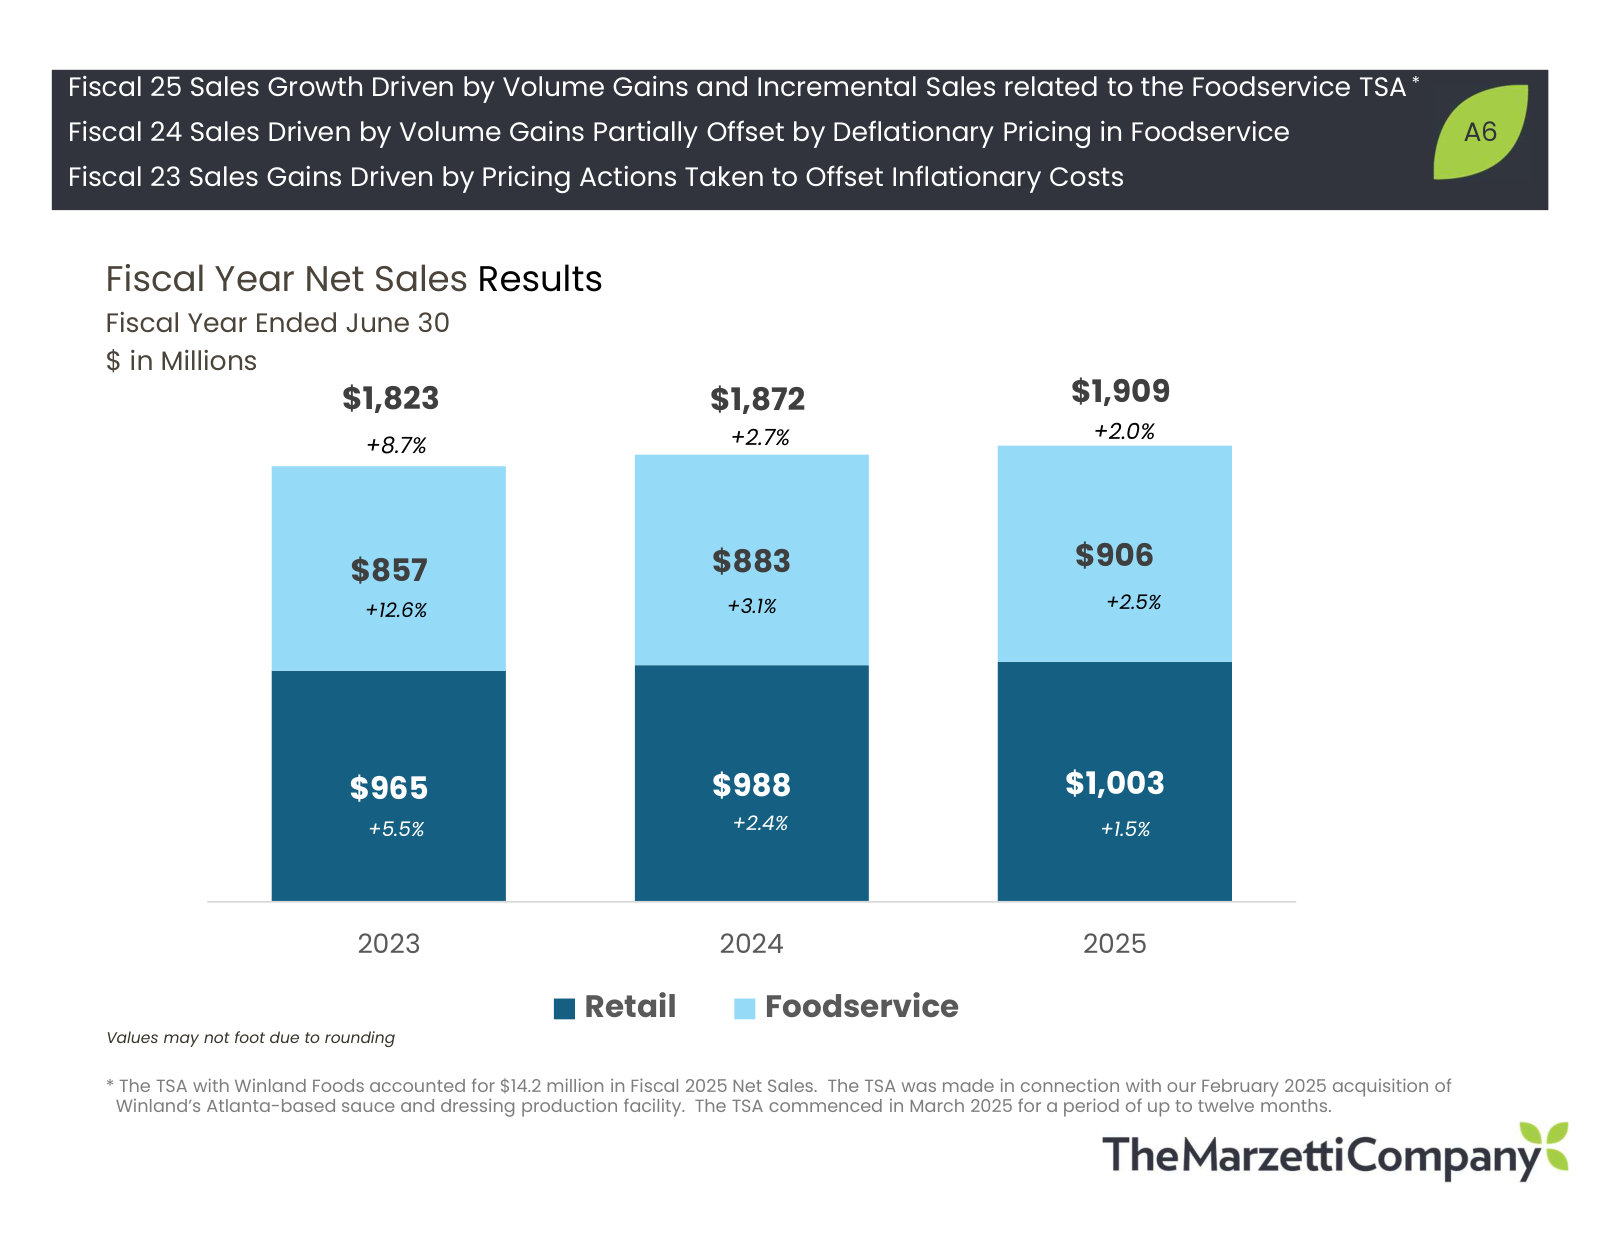
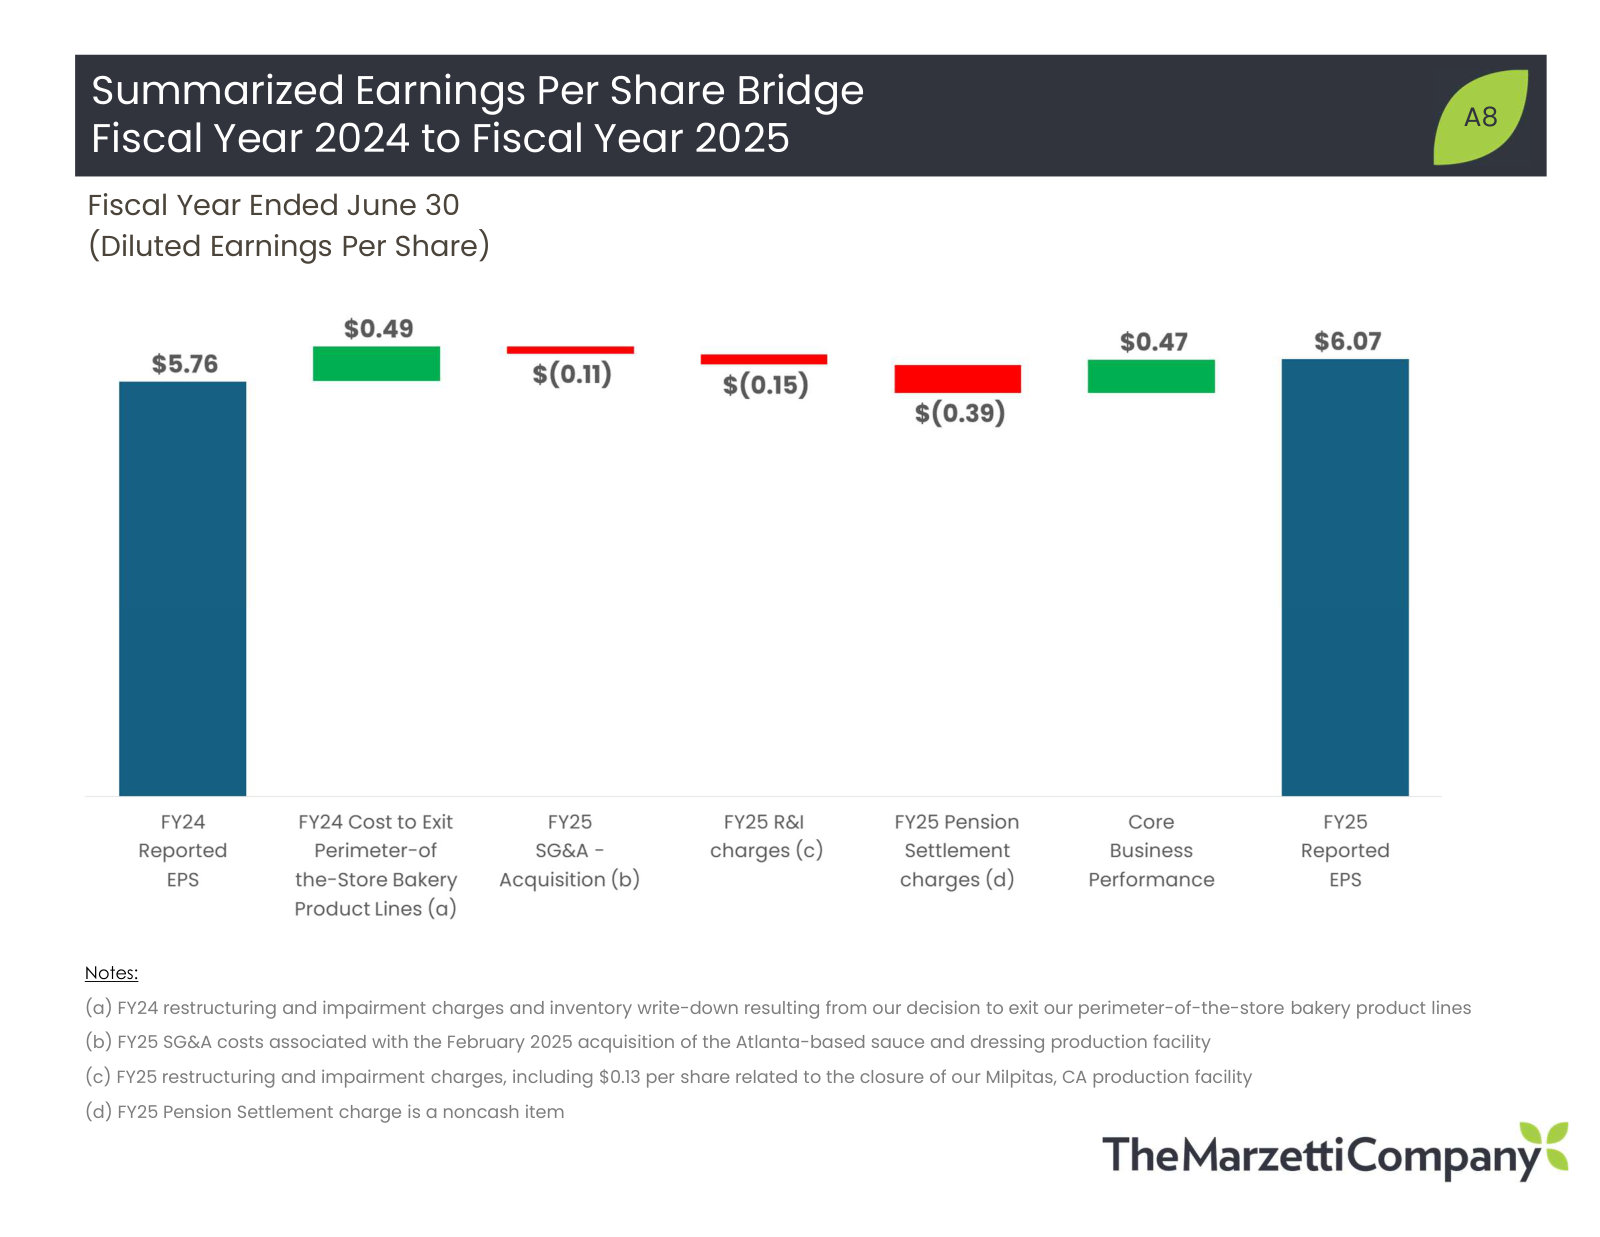
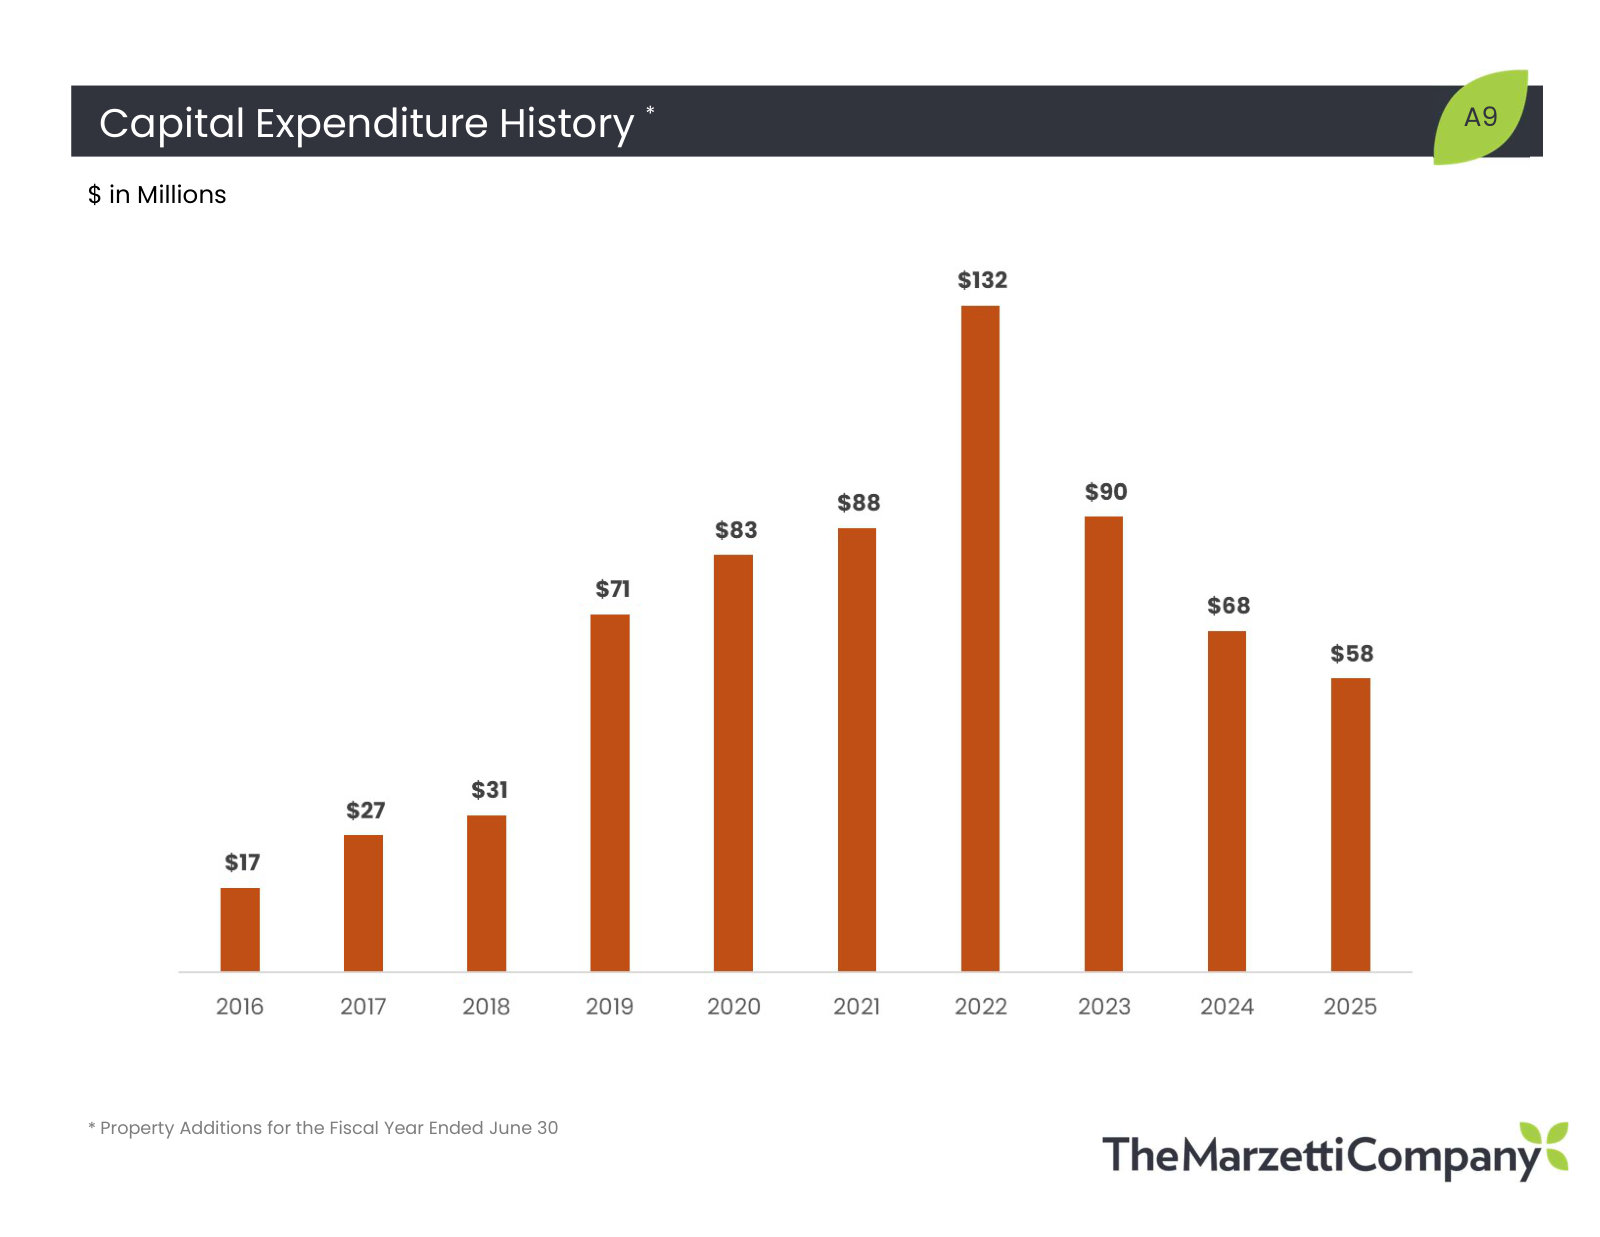
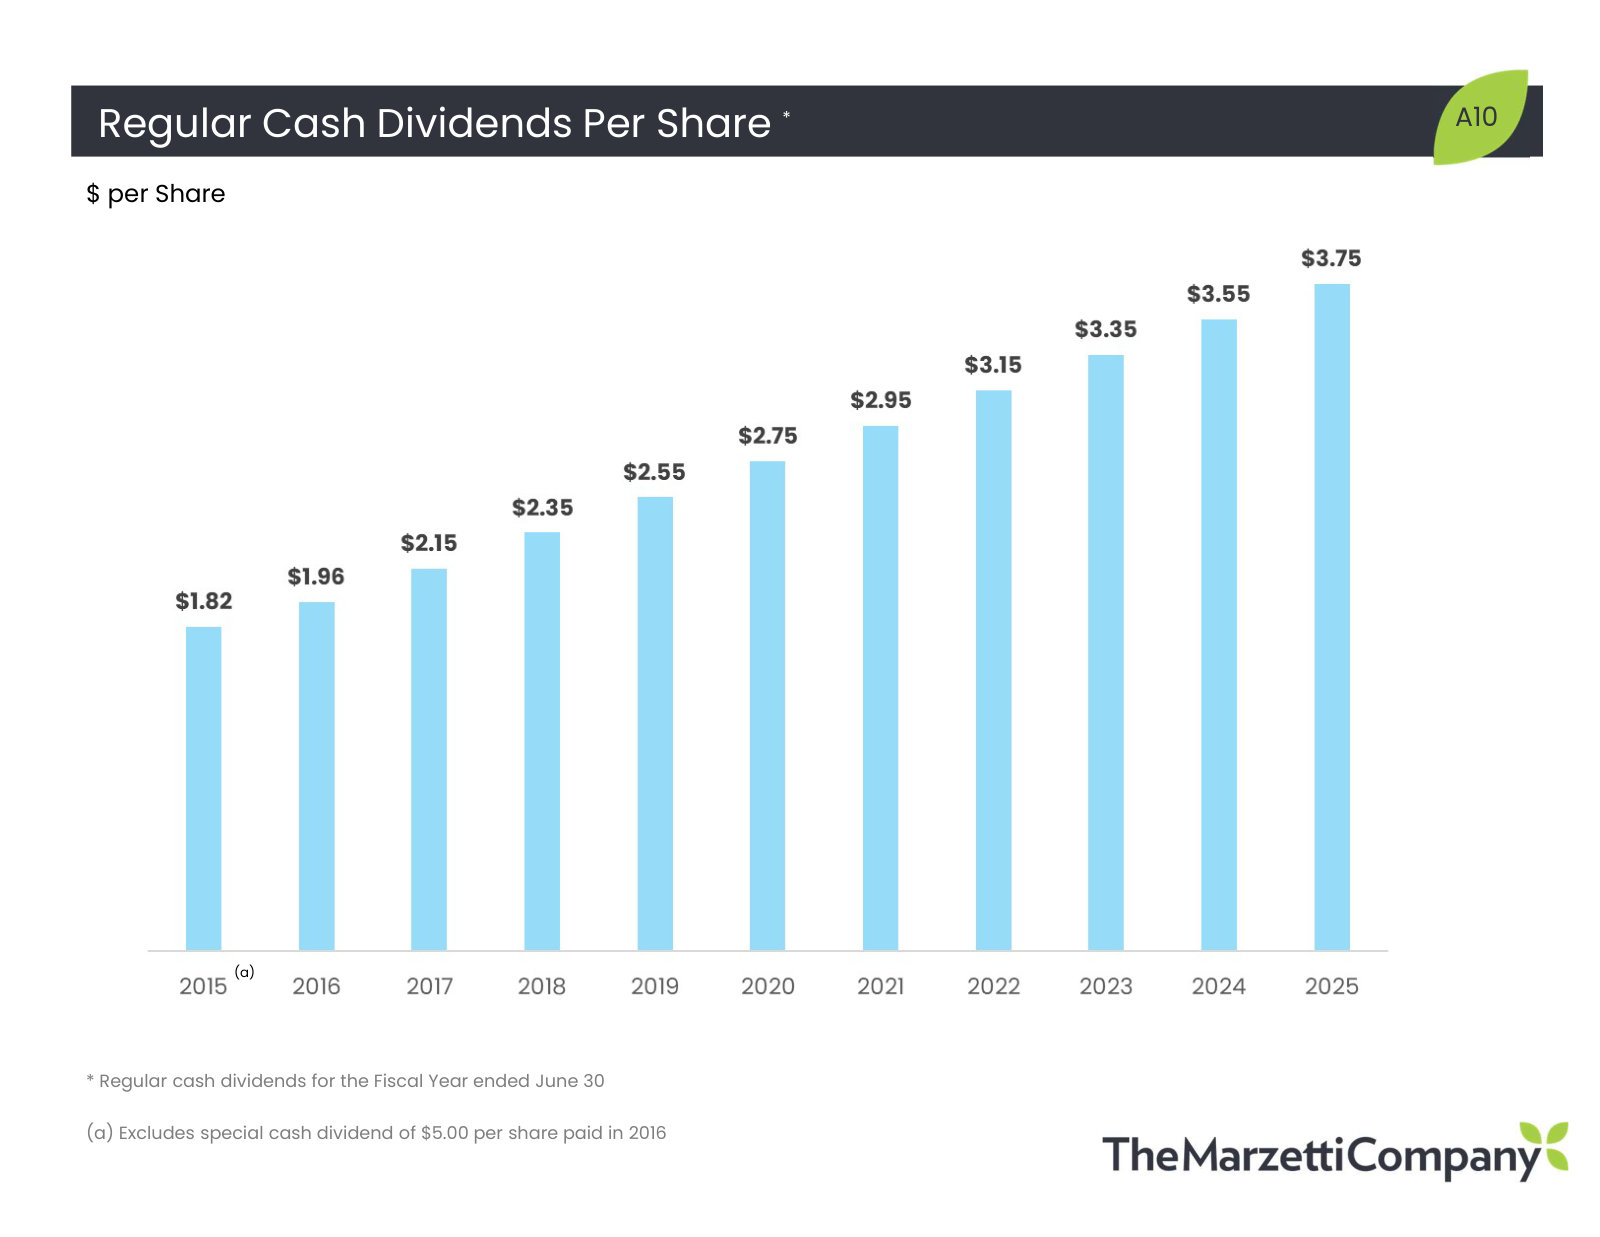
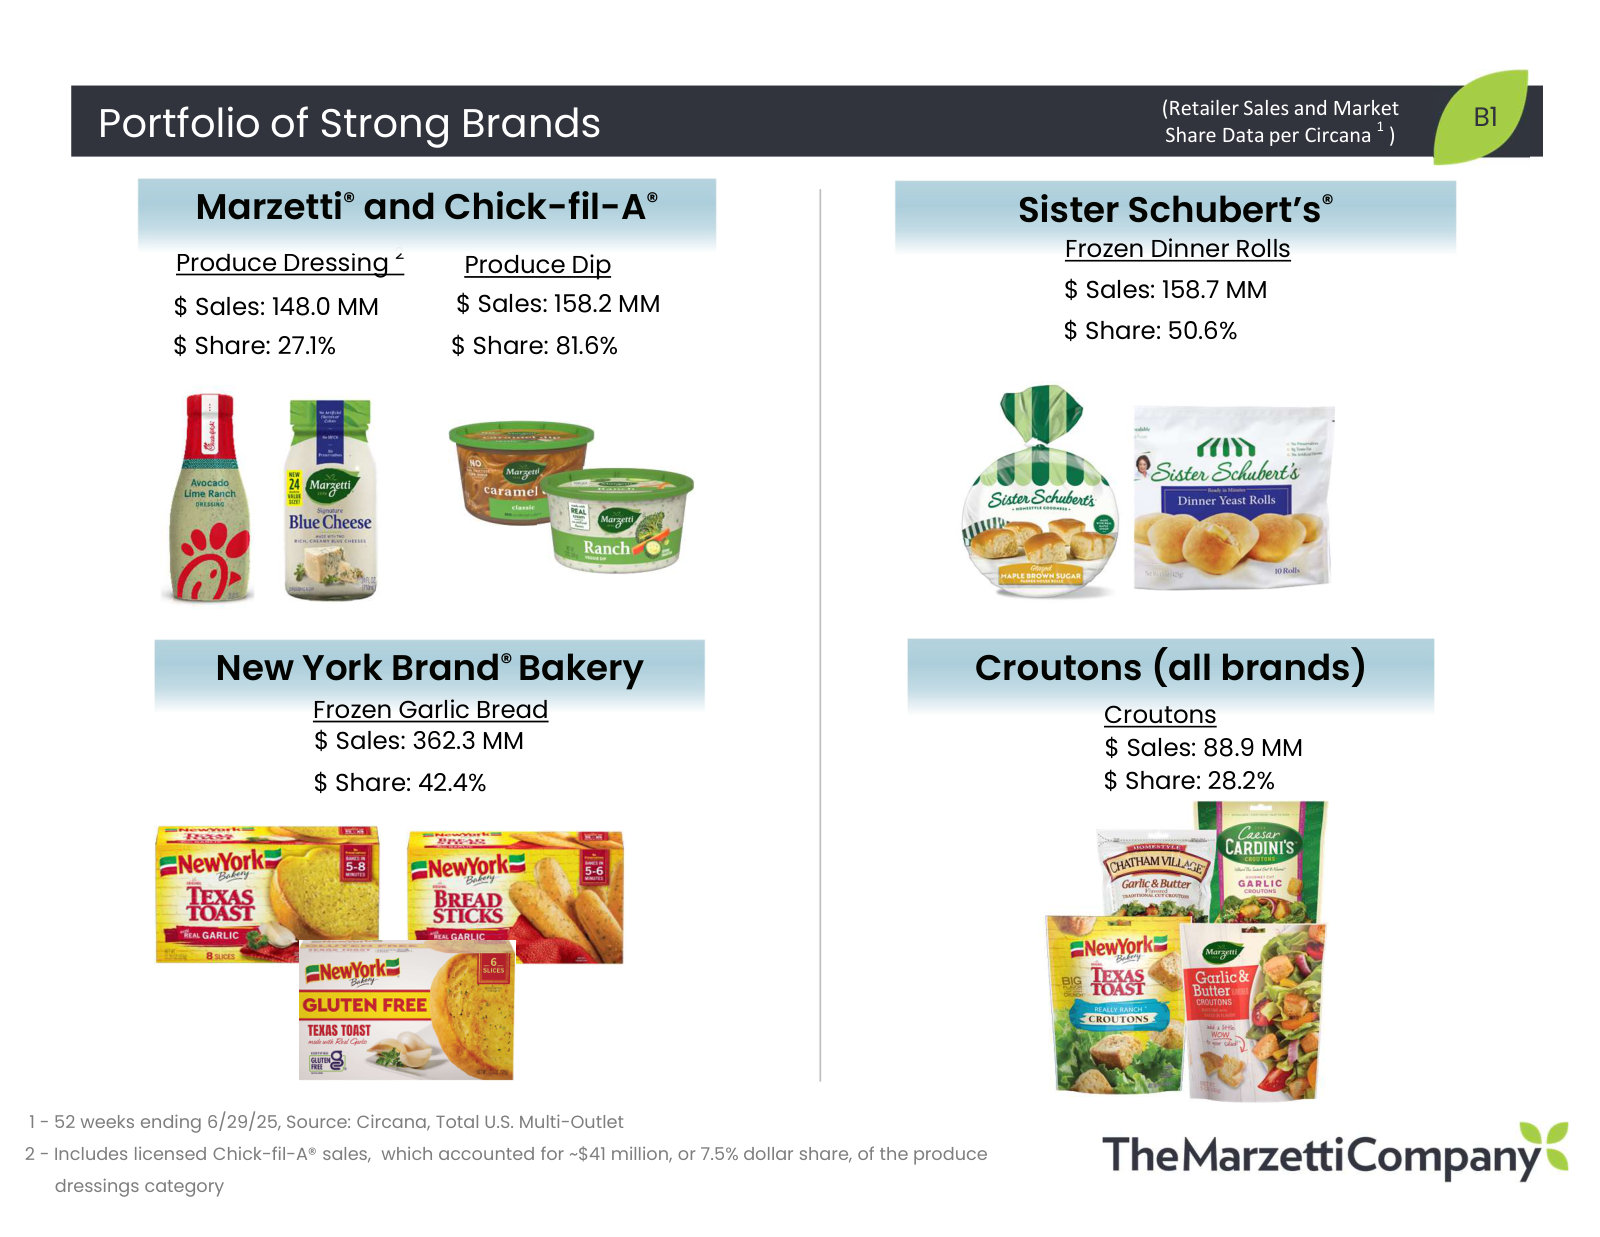
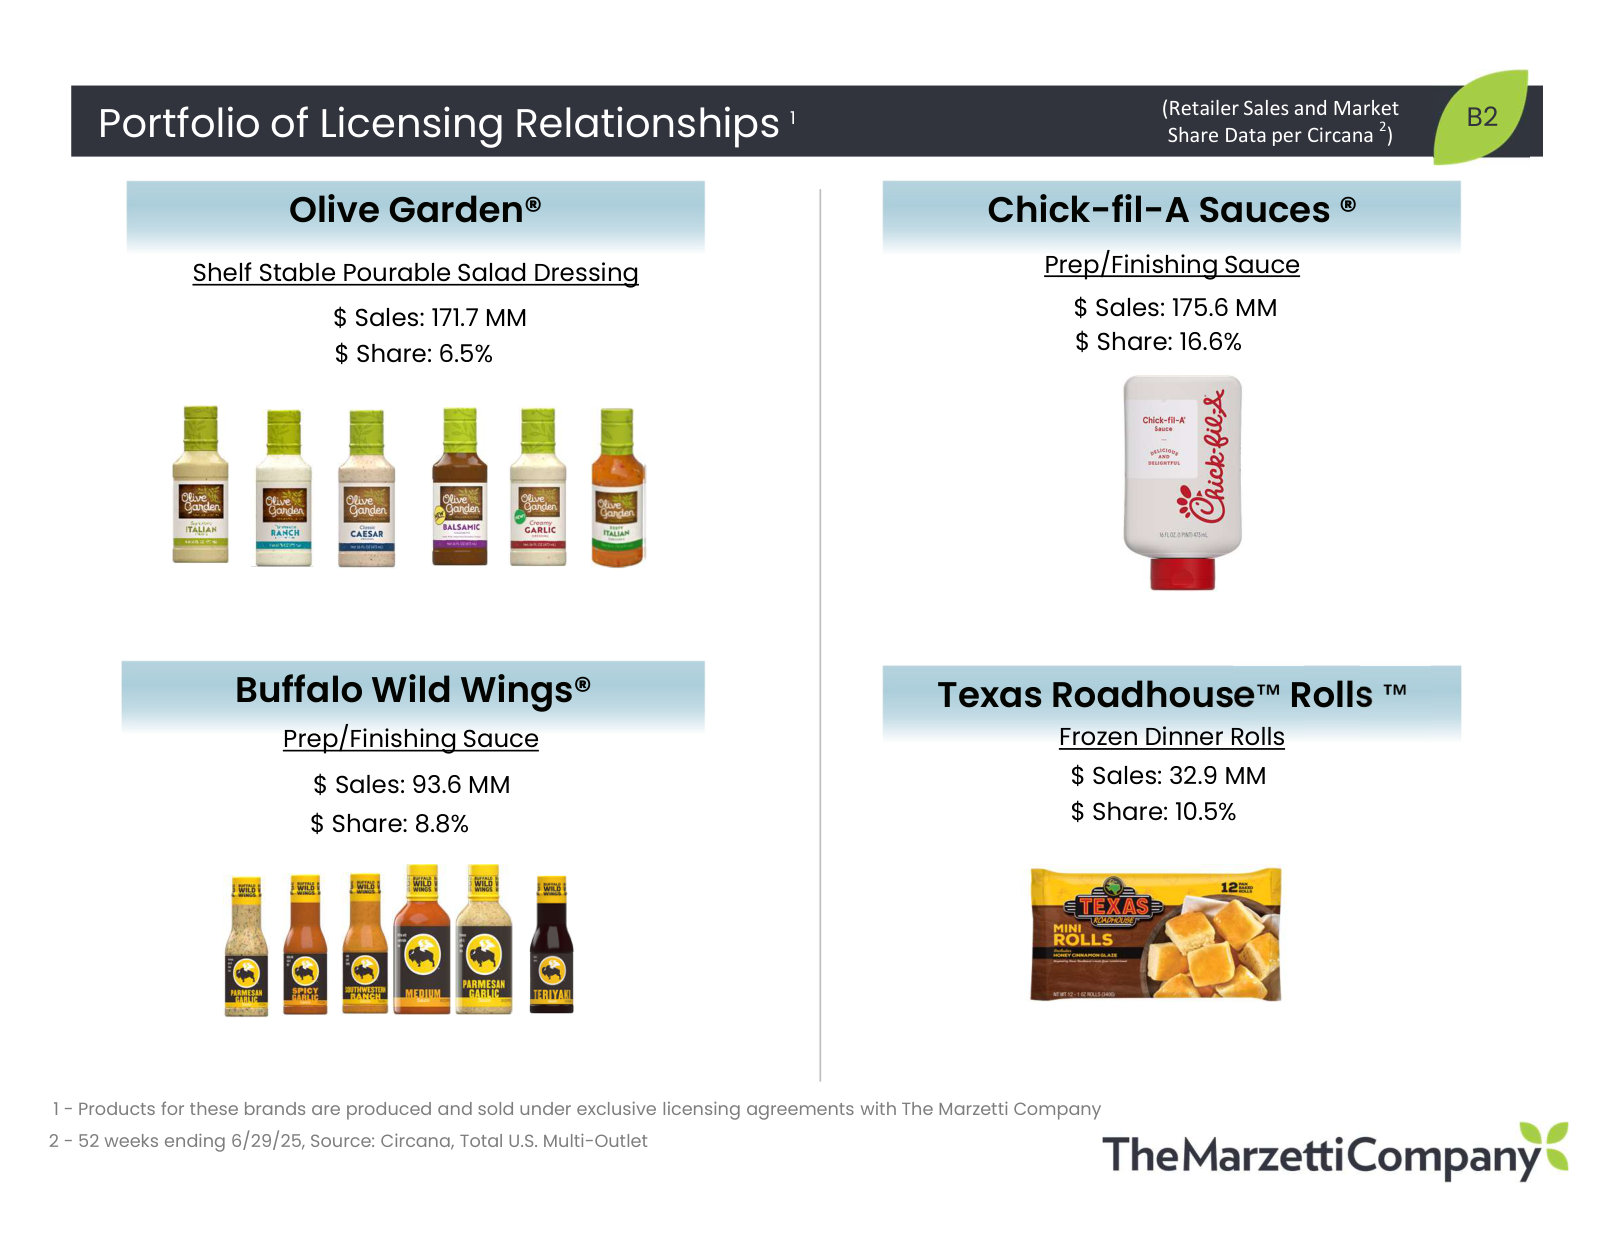
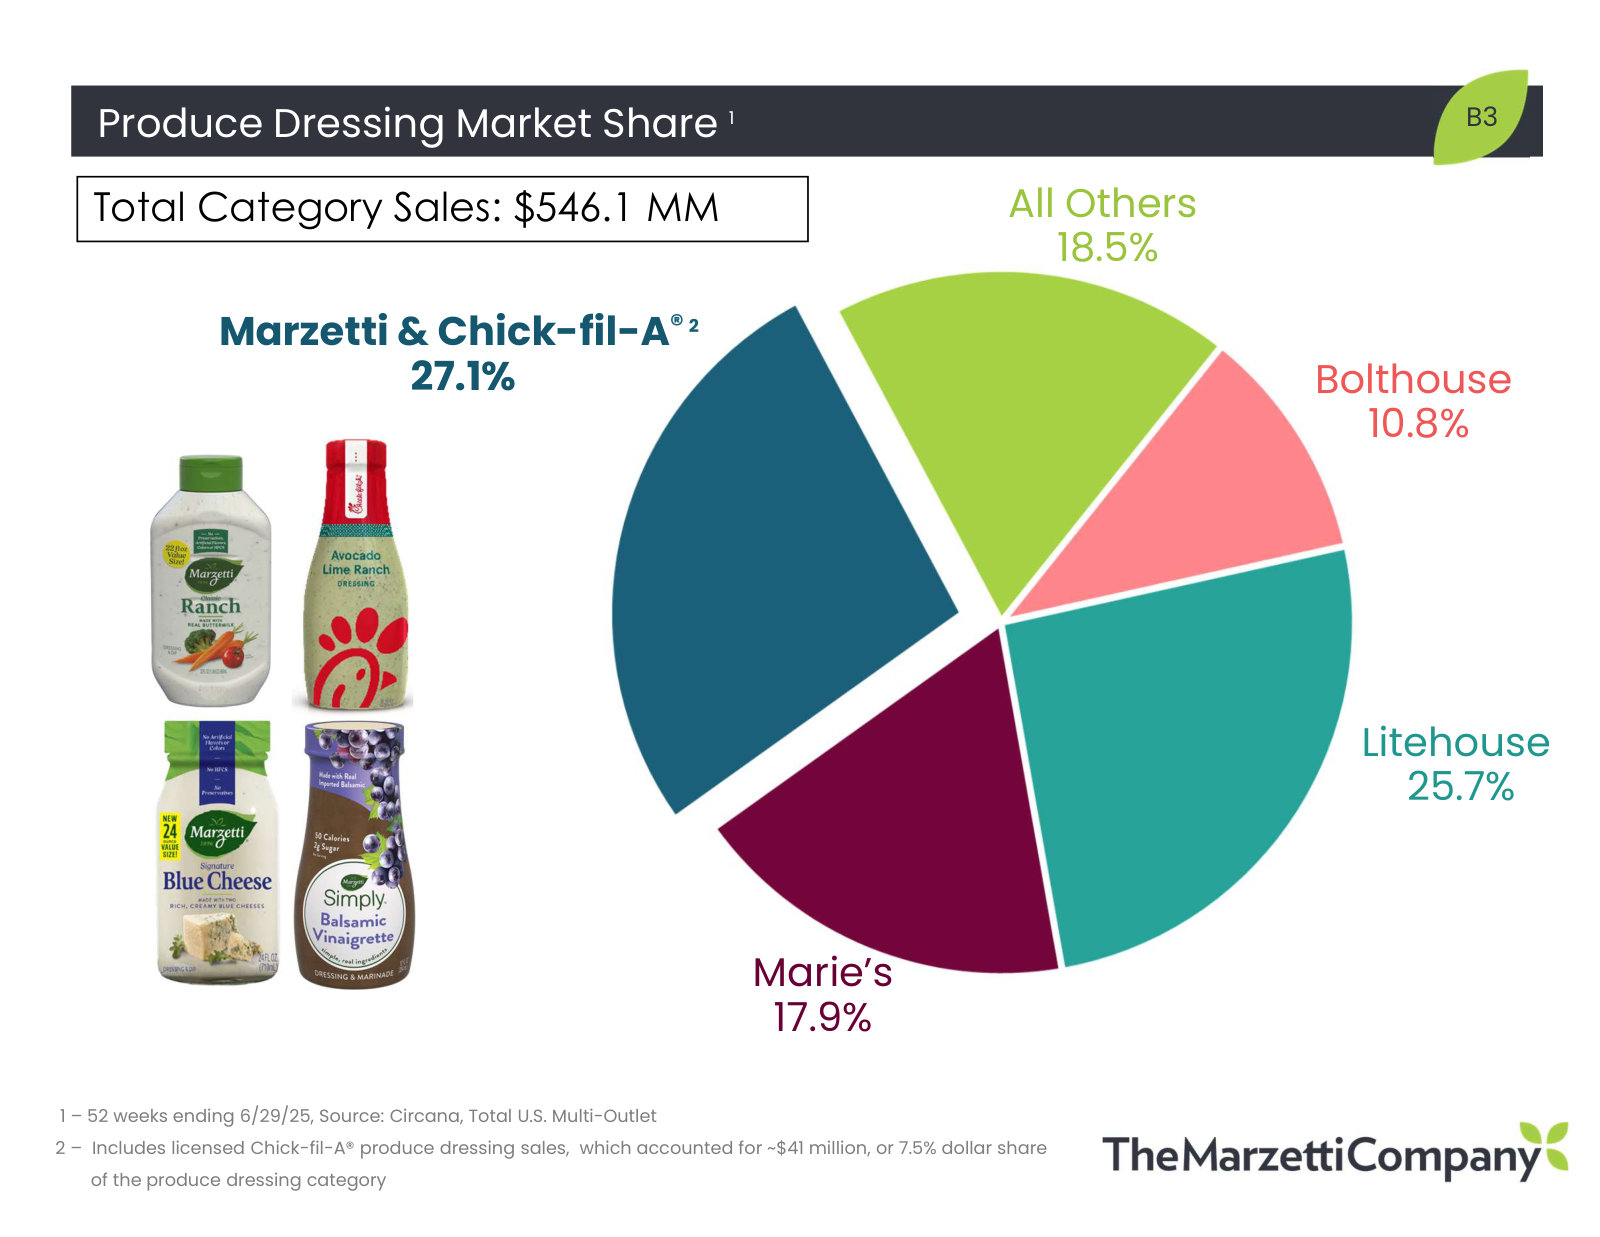
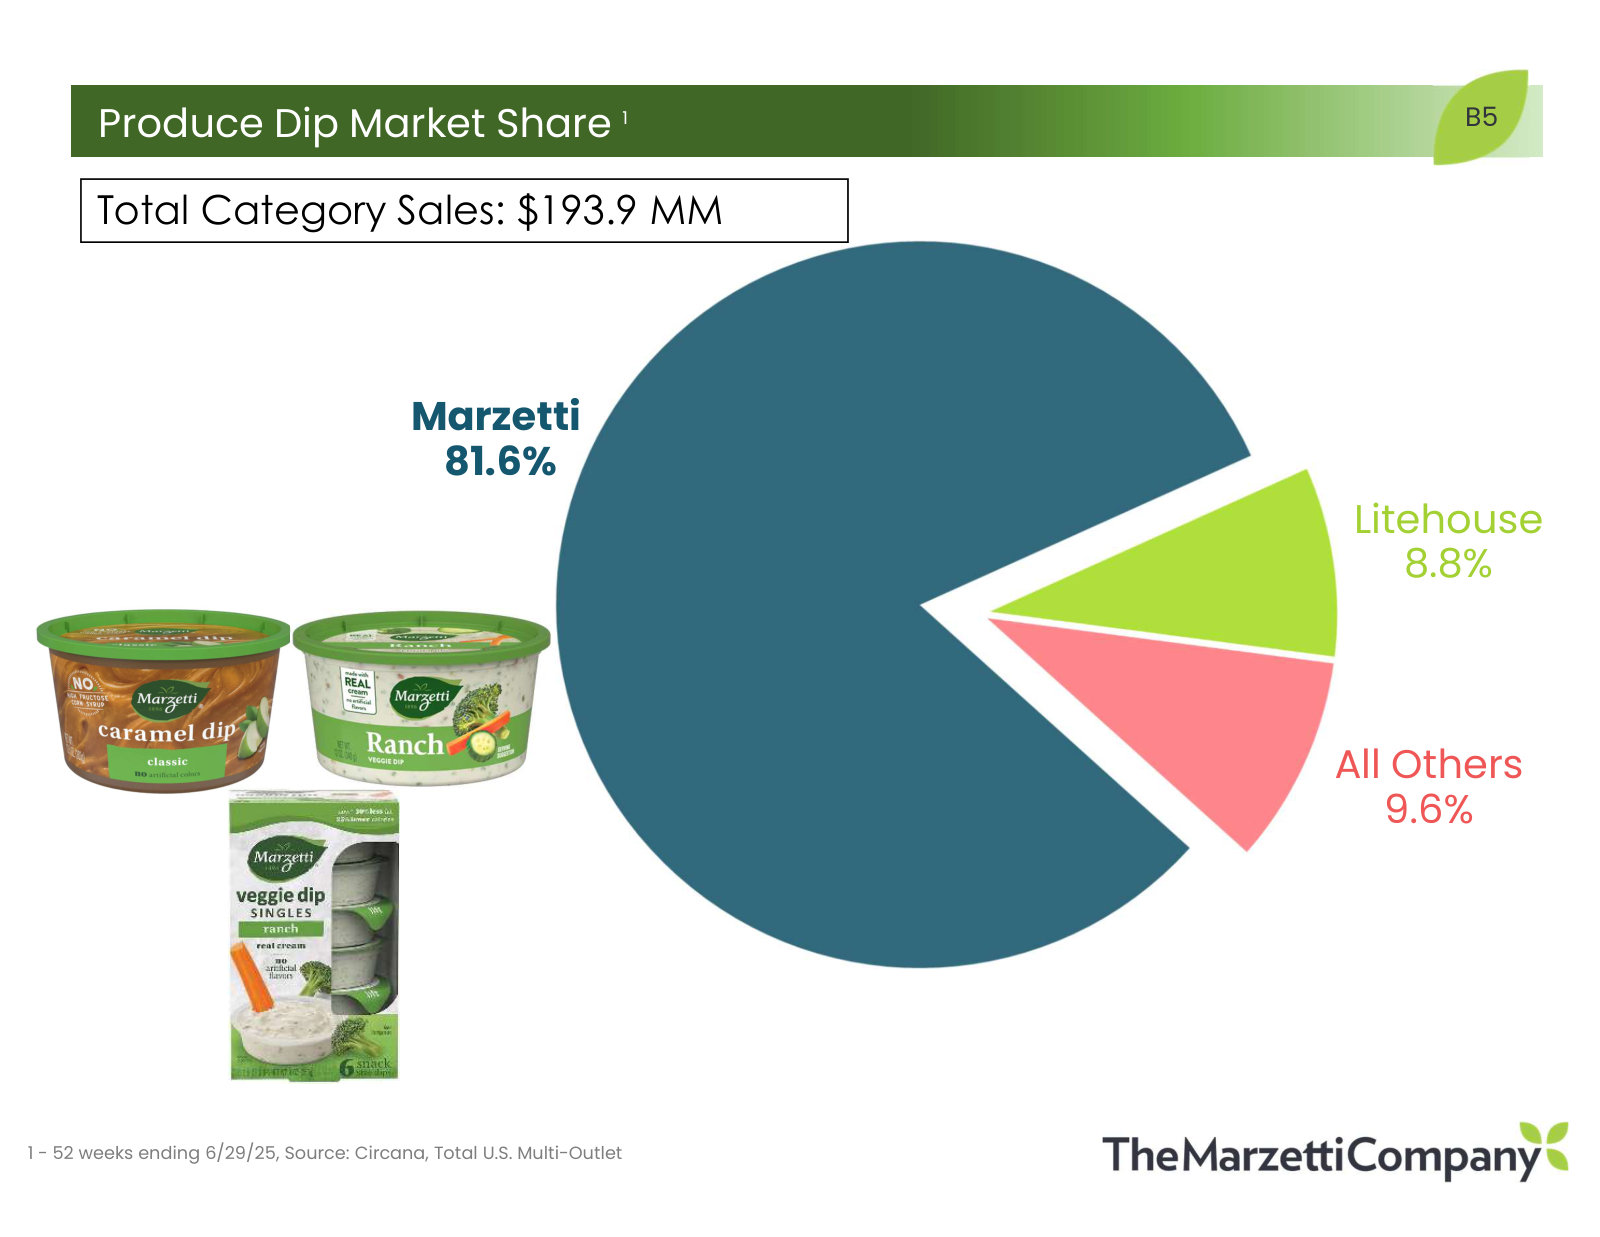
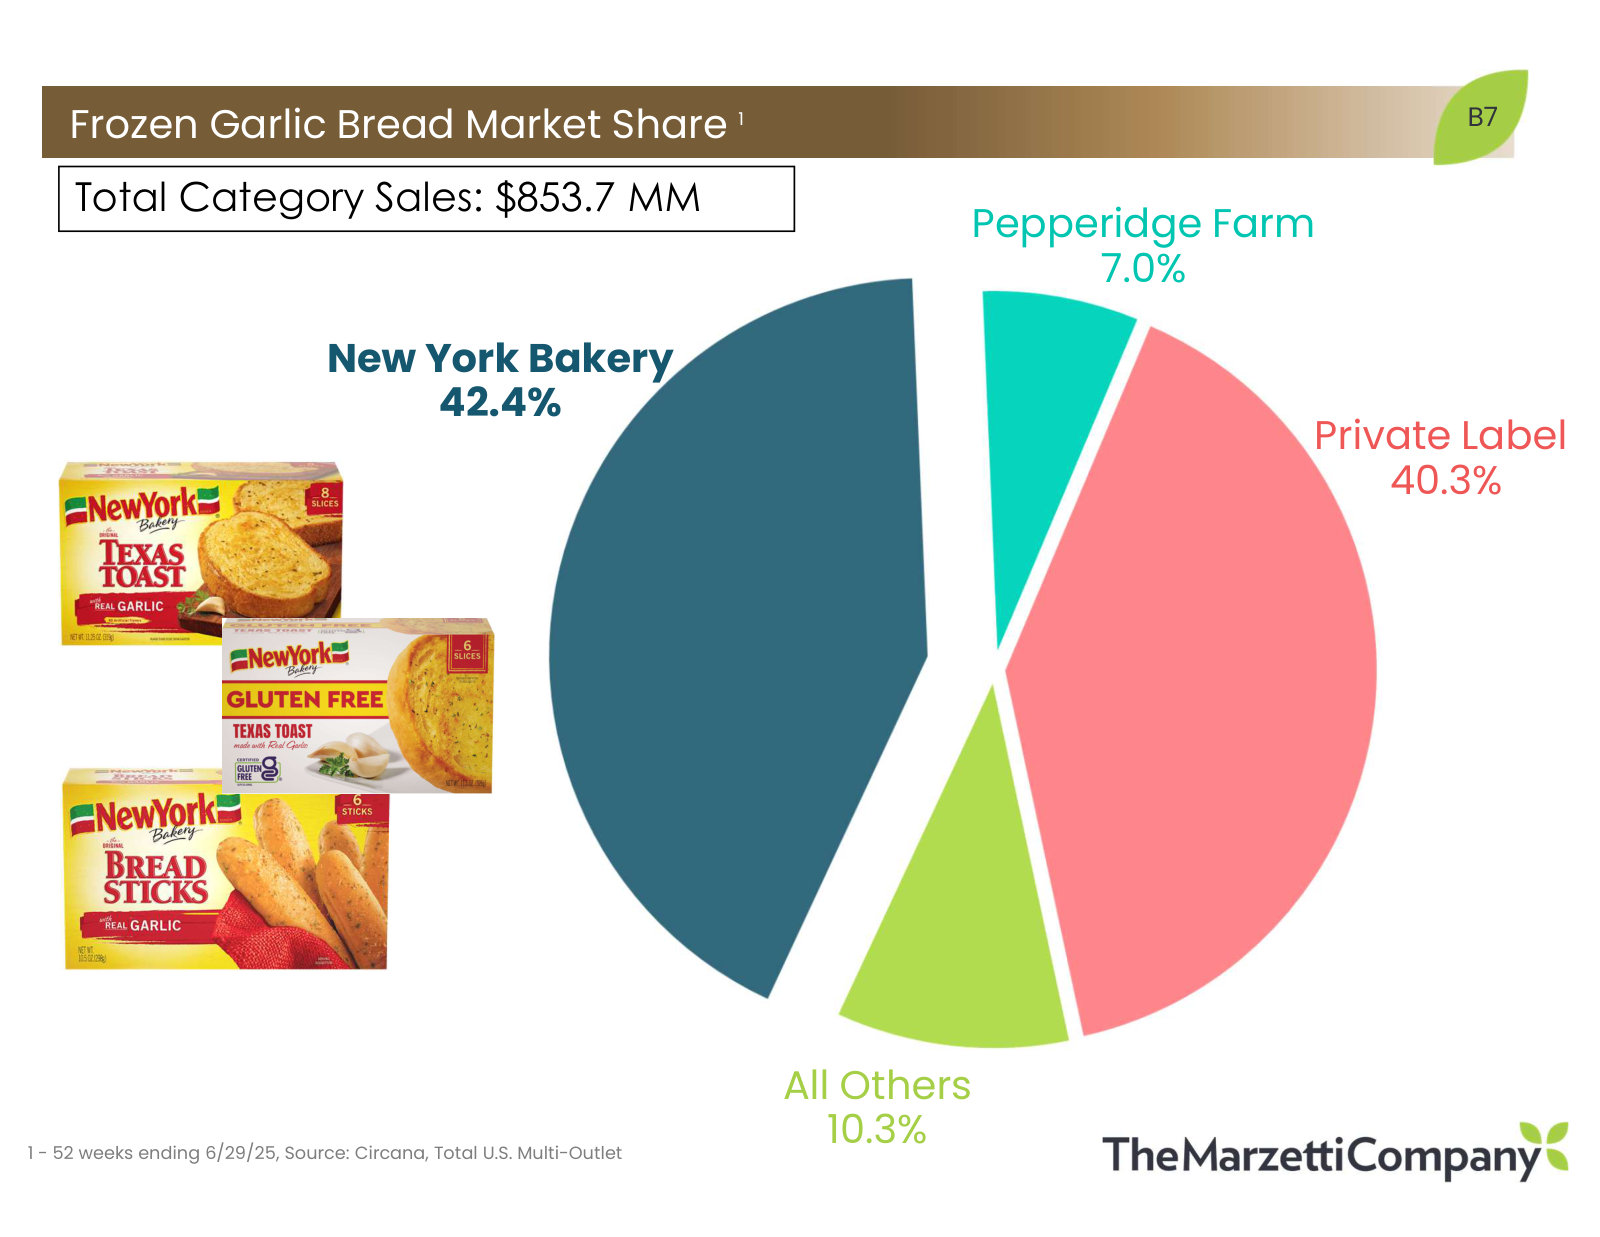
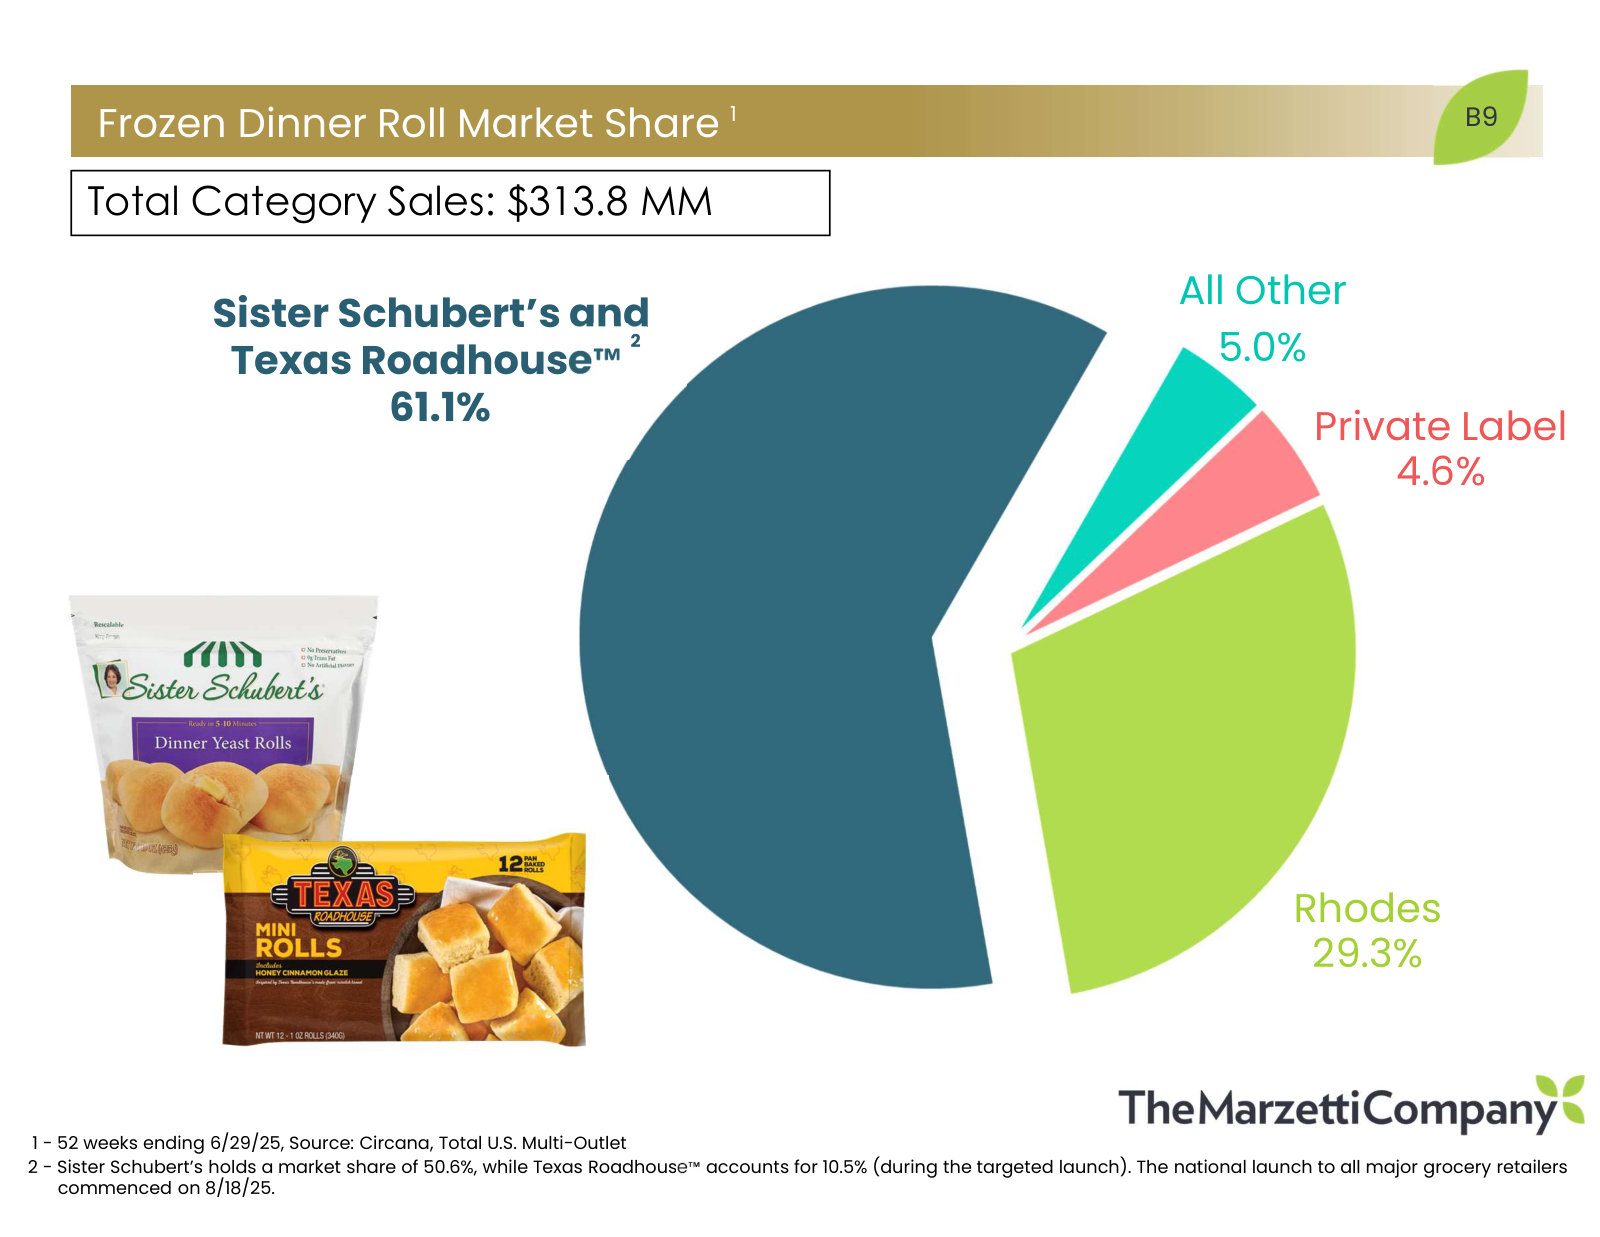
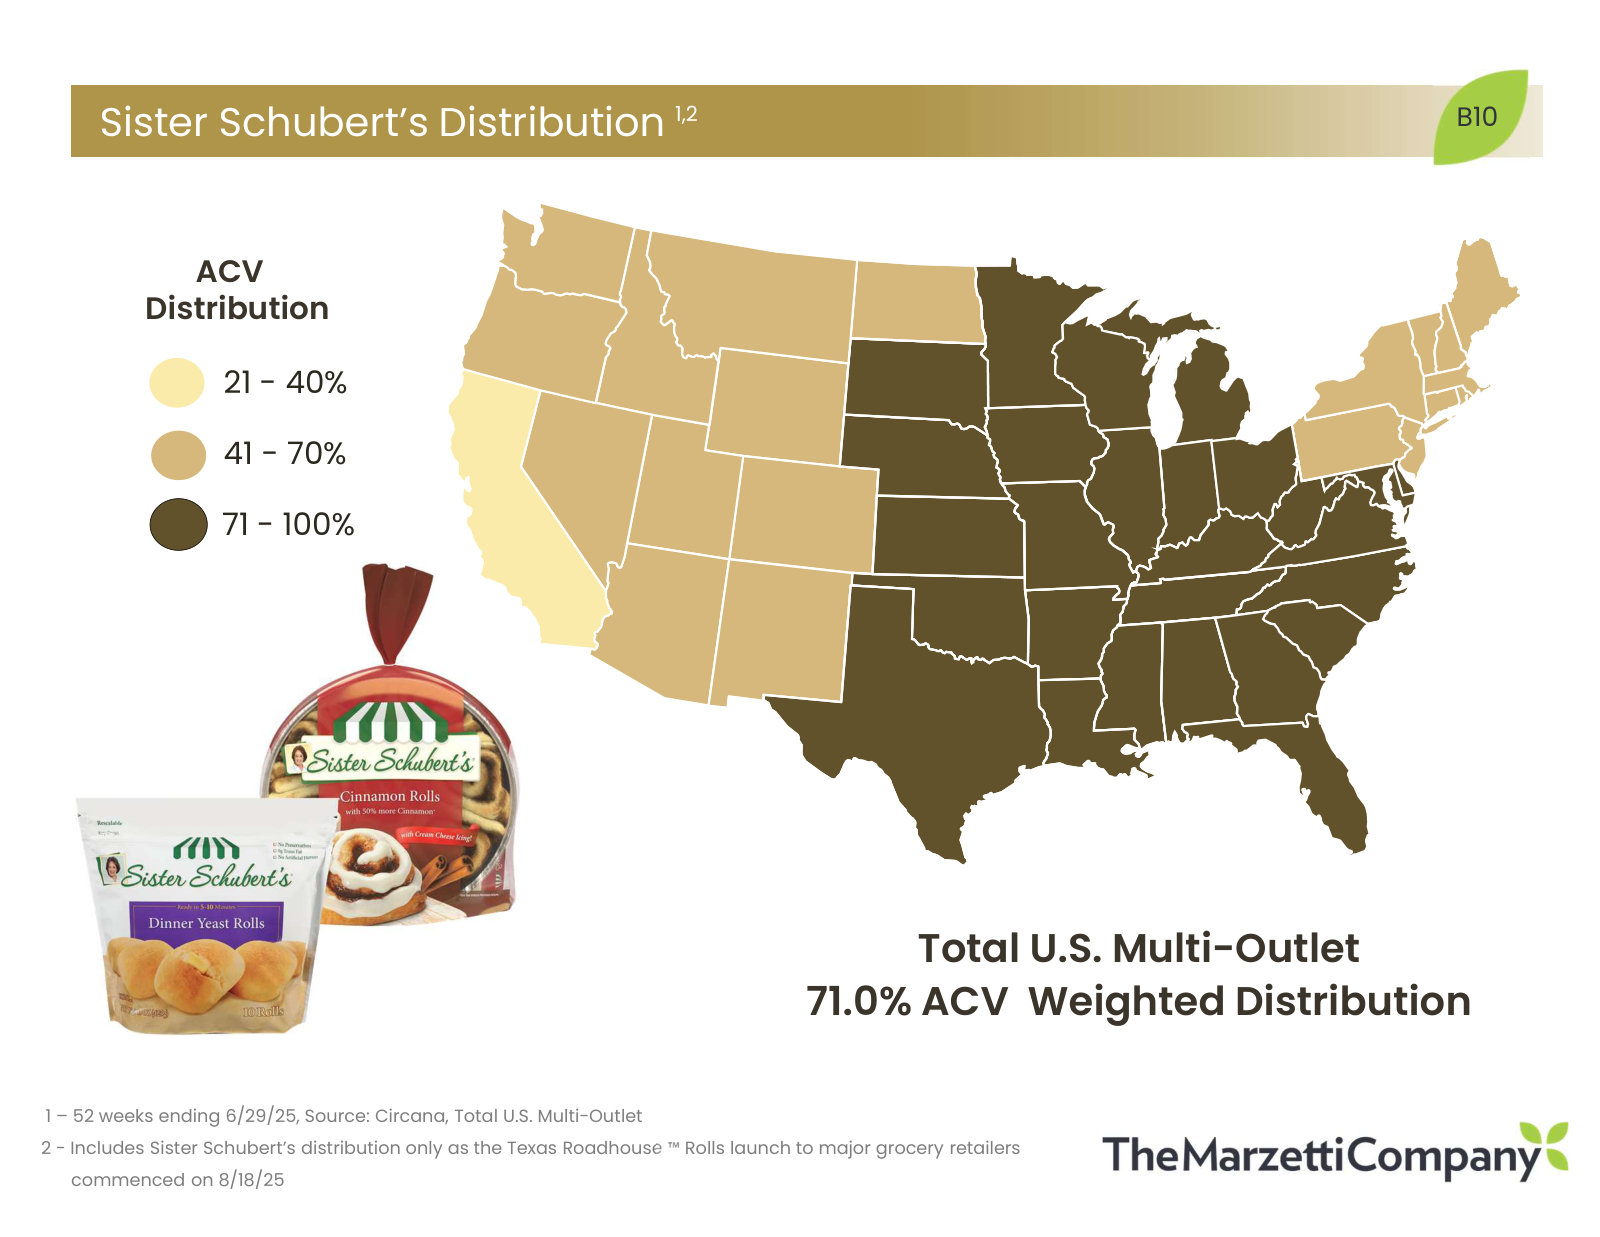
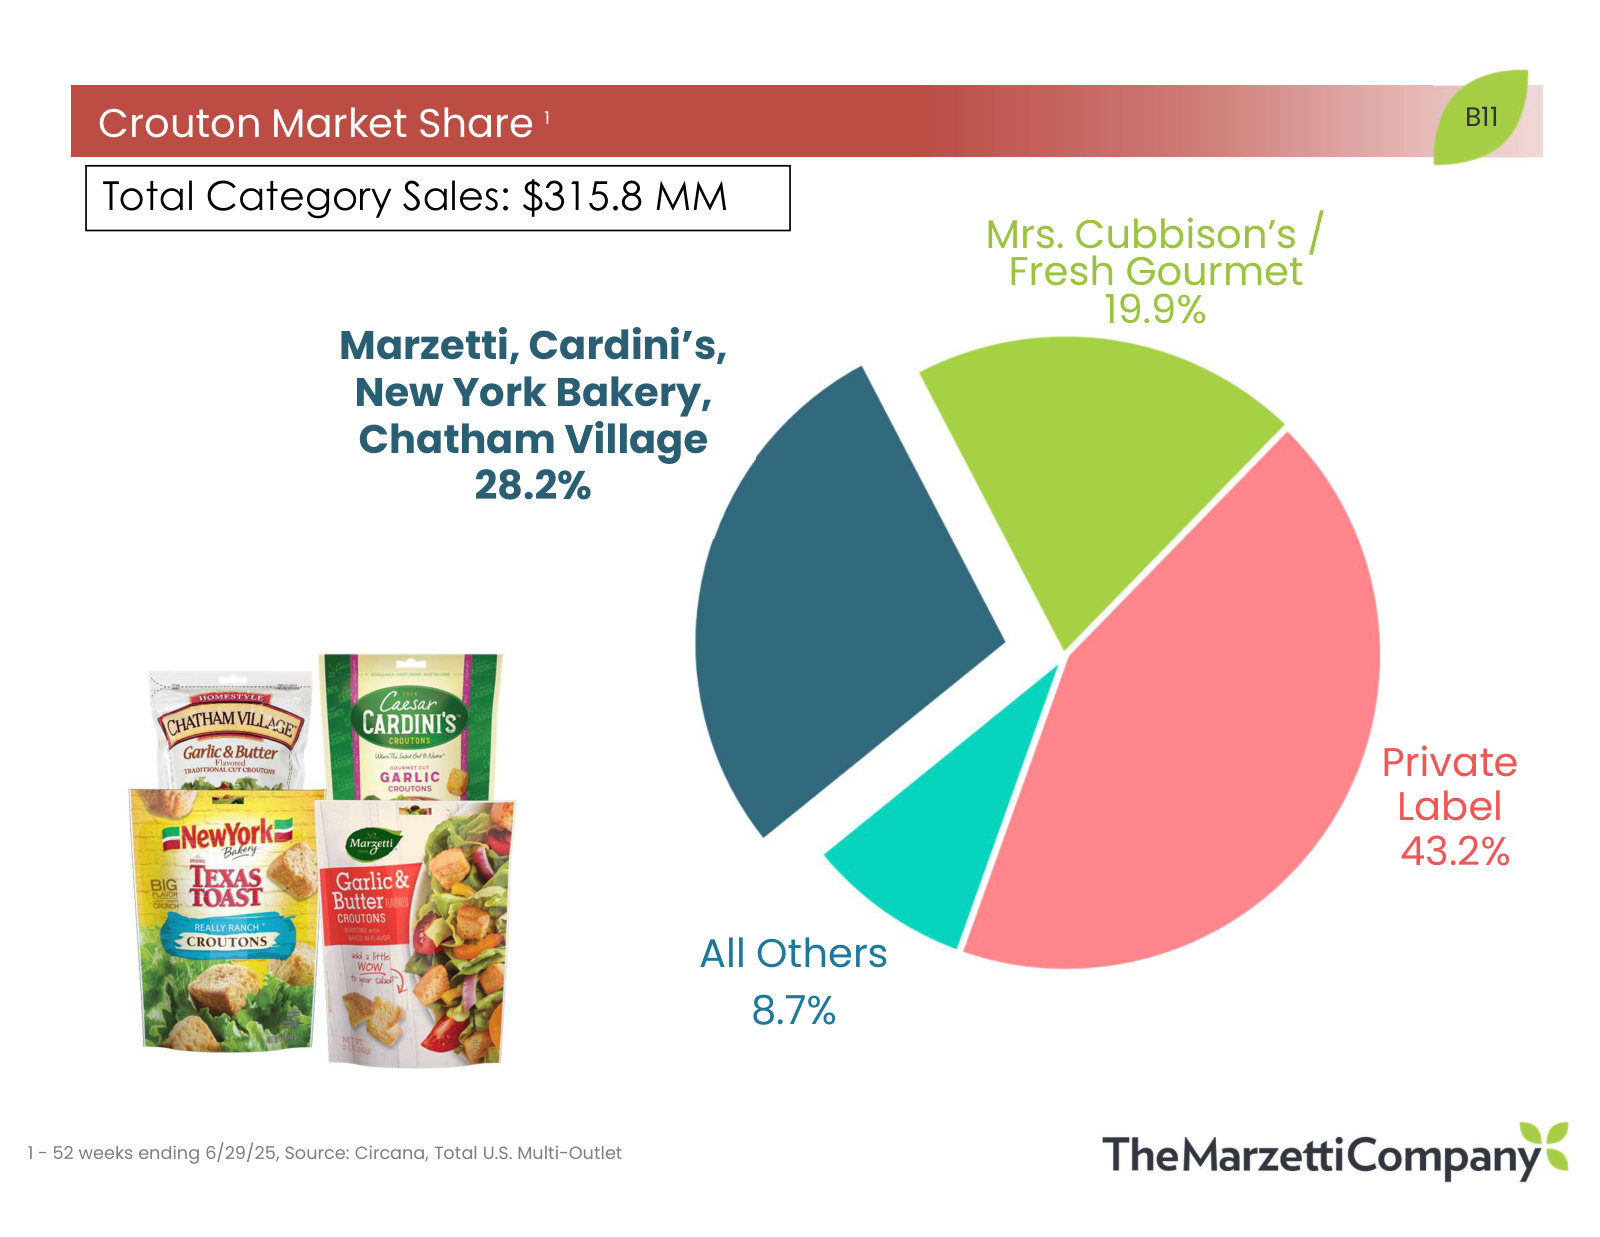
p. 3 — What the company is in one page: specialty food maker, $1.9bn FY25 sales, 13 plants in seven states, ~3,800 employees. · Open the full presentation →p. 4 — The framing management leads with: category share, 17 of the top 30 restaurant chains, 63 years of dividend increases. · Open the full presentation →p. 5 — Sales from ~$200m to ~$1.9bn since 1971, with each acquisition and licensing deal marked on the curve — how the company was built. · Open the full presentation →p. 6 — Retail is 53% of sales; the pie splits it into shelf-stable dressings and sauces, frozen breads, and refrigerated dressings and dips. · Open the full presentation →p. 7 — Foodservice is the other 47%, and 77% of it is national restaurant accounts — the customer concentration in one chart. · Open the full presentation →p. 8 — The strategy in management's own words: grow volumes low-to-mid single digit, grow margins, expand through licensing and M&A. · Open the full presentation →p. 9 — The retail pipeline by brand and ship date — Chick-fil-A, Buffalo Wild Wings and Olive Garden items landing in spring 2026. · Open the full presentation →p. 10 — The rest of the pipeline: Texas Roadhouse rolls, New York Bakery, Sister Schubert's and the Marzetti protein platform. · Open the full presentation →p. 11 — The licensing model quantified: ~$560m of licensed retail sales, up 5.4%, against a $14.6bn addressable dressings and sauces category. · Open the full presentation →p. 12 — The M&A screen management applies — branded shelf-stable sauces, demonstrated growth, margin accretion, funded off the balance sheet. · Open the full presentation →p. 13 — Bachan's after closing on 1 May 2026: sales up over 25%, now the second-leading retail brand in barbecue sauce. · Open the full presentation →p. 15 — What was bought: an $87m-revenue Japanese barbecue sauce brand compounding at 48% a year over three years. · Open the full presentation →p. 16 — How the deal was paid for and what it should do — cash plus a $200m term loan, pro forma leverage under 1.0x, dividend unchanged. · Open the full presentation →p. 18 — The value-engineering framework used to take cost out — how the company defends gross margin against input inflation. · Open the full presentation →p. 20 — The Horse Cave, Kentucky sauce and dressing expansion: 192,000 square feet and ~$140m, the capacity behind licensing growth. · Open the full presentation →p. 21 — The February 2025 Atlanta plant purchase — ~250,000 square feet for $79m, and the source of the temporary supply agreement sales. · Open the full presentation →p. 23 — Why the R&D and culinary team matters: it is the capability that wins and holds the restaurant licensing agreements. · Open the full presentation →p. 24 — Fiscal 2026 through nine months: sales +2.2%, gross profit +3.9%, operating income roughly flat as SG&A rose 7.2%. · Open the full presentation →p. 25 — A debt-free balance sheet with $218m of cash at March 2026, plus the revolver and term loan used for the Bachan's deal. · Open the full presentation →p. 26 — Where the cash goes — FY25 uses split across dividends, capex and acquisitions, with FY26 capex guided to ~$80m. · Open the full presentation →p. 32 — Three fiscal years side by side: gross margin from 21.3% to 23.9% and operating margin from 7.8% to 11.5% on modest sales growth. · Open the full presentation →p. 33 — Net sales by segment for FY23-FY25, showing retail and foodservice growth rates converging toward ~2%. · Open the full presentation →p. 35 — The FY24-to-FY25 earnings bridge, separating core performance from bakery exit costs, acquisition charges and the pension settlement. · Open the full presentation →p. 36 — Ten years of capital expenditure, peaking at $132m in FY22 for the Horse Cave build and falling to $58m in FY25. · Open the full presentation →p. 37 — Dividends per share since 2015 — the record management points to most often, and the shape of the payout policy. · Open the full presentation →p. 39 — The core brands with category sales and share: produce dip 81.6%, frozen garlic bread 42.4%, frozen dinner rolls 50.6%. · Open the full presentation →p. 40 — The licensed brands on the same basis — Chick-fil-A sauces, Olive Garden dressings, Buffalo Wild Wings and Texas Roadhouse rolls. · Open the full presentation →p. 41 — Produce dressing: a $546m category where Marzetti and Chick-fil-A hold 27.1% against Litehouse and Marie's. · Open the full presentation →p. 43 — Produce dip: a $194m category the company effectively owns at 81.6% share. · Open the full presentation →p. 45 — Frozen garlic bread: New York Bakery at 42.4% of an $854m category, with private label at 40.3% — the real competitor here. · Open the full presentation →p. 47 — Frozen dinner rolls: Sister Schubert's and Texas Roadhouse together at 61.1%, against Rhodes at 29.3%. · Open the full presentation →p. 48 — Distribution headroom made visible — Sister Schubert's at 71% national ACV with the West still thin; the deck repeats this map by brand. · Open the full presentation →p. 49 — Croutons: the four company brands hold 28.2% while private label takes 43.2% — the weakest position in the portfolio. · Open the full presentation →
The latest quarterly deck - segment volume and pricing detail, plus the margin and earnings bridges the overview deck only summarizes. · Open the full document →
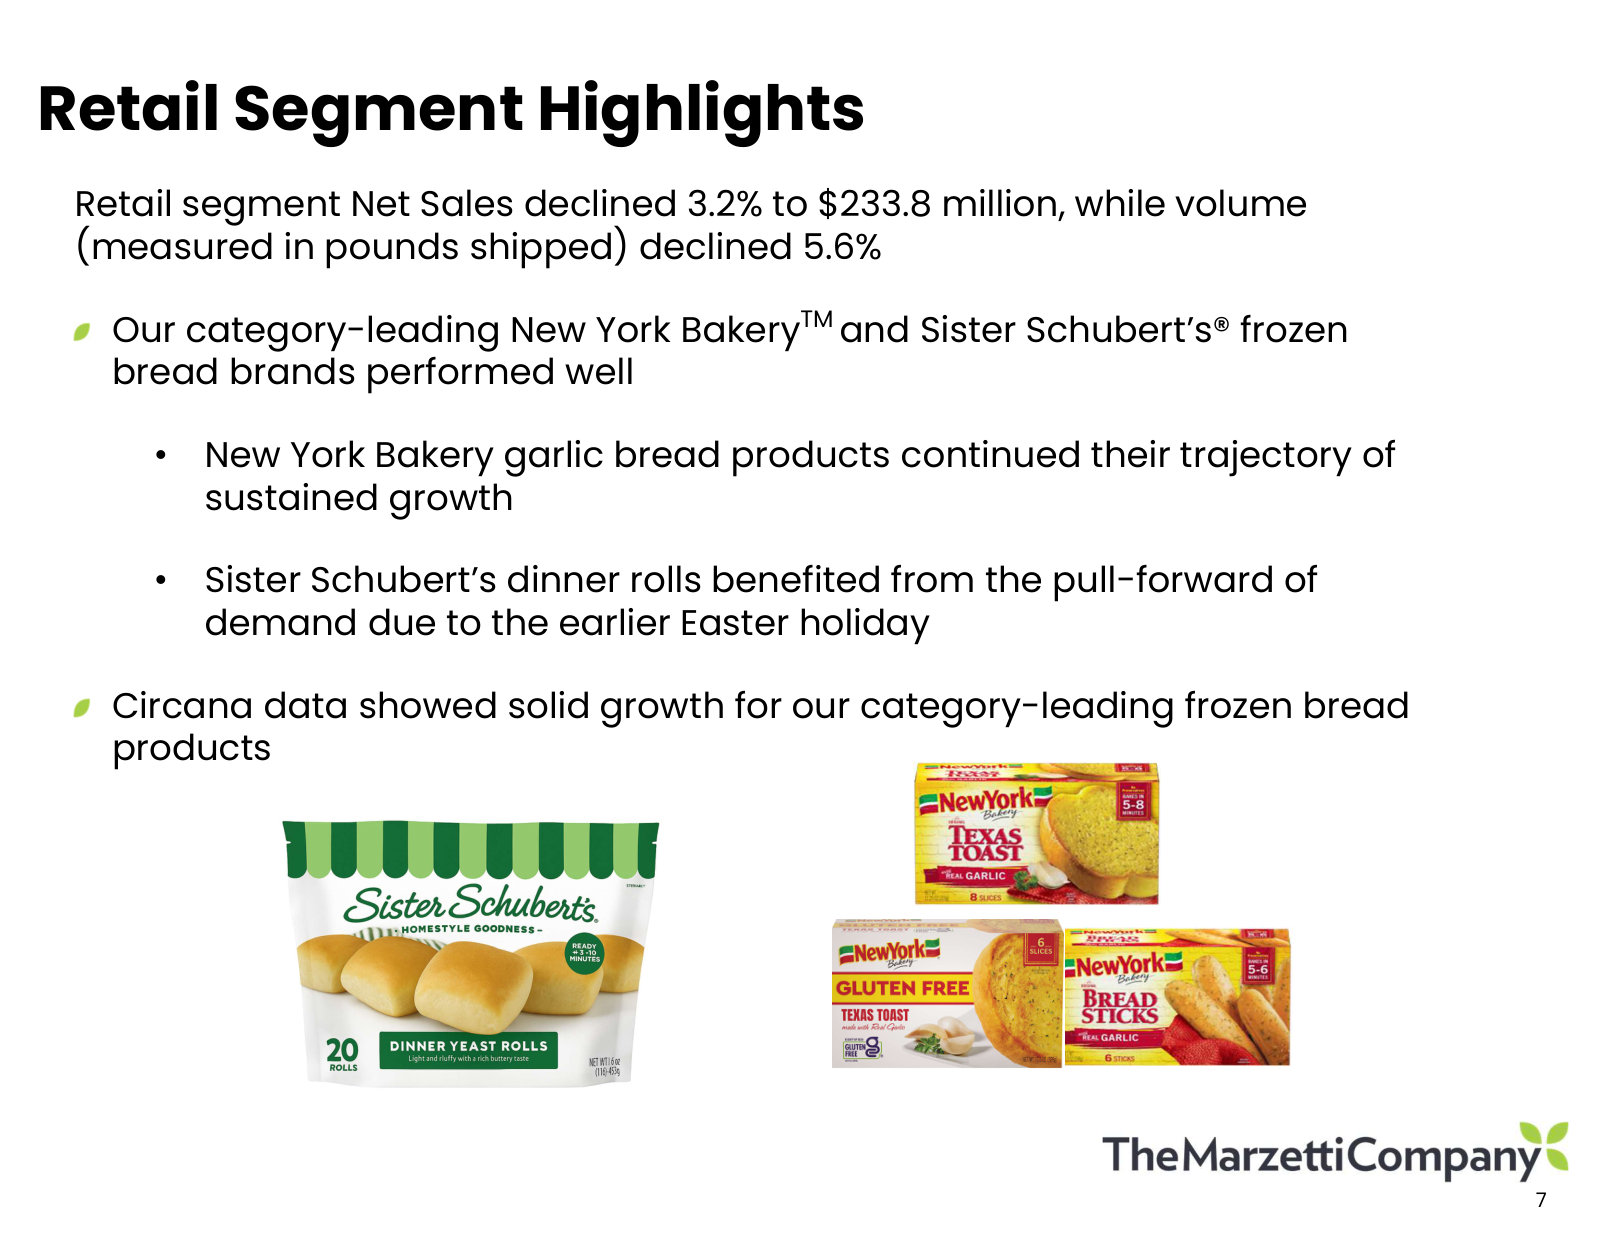
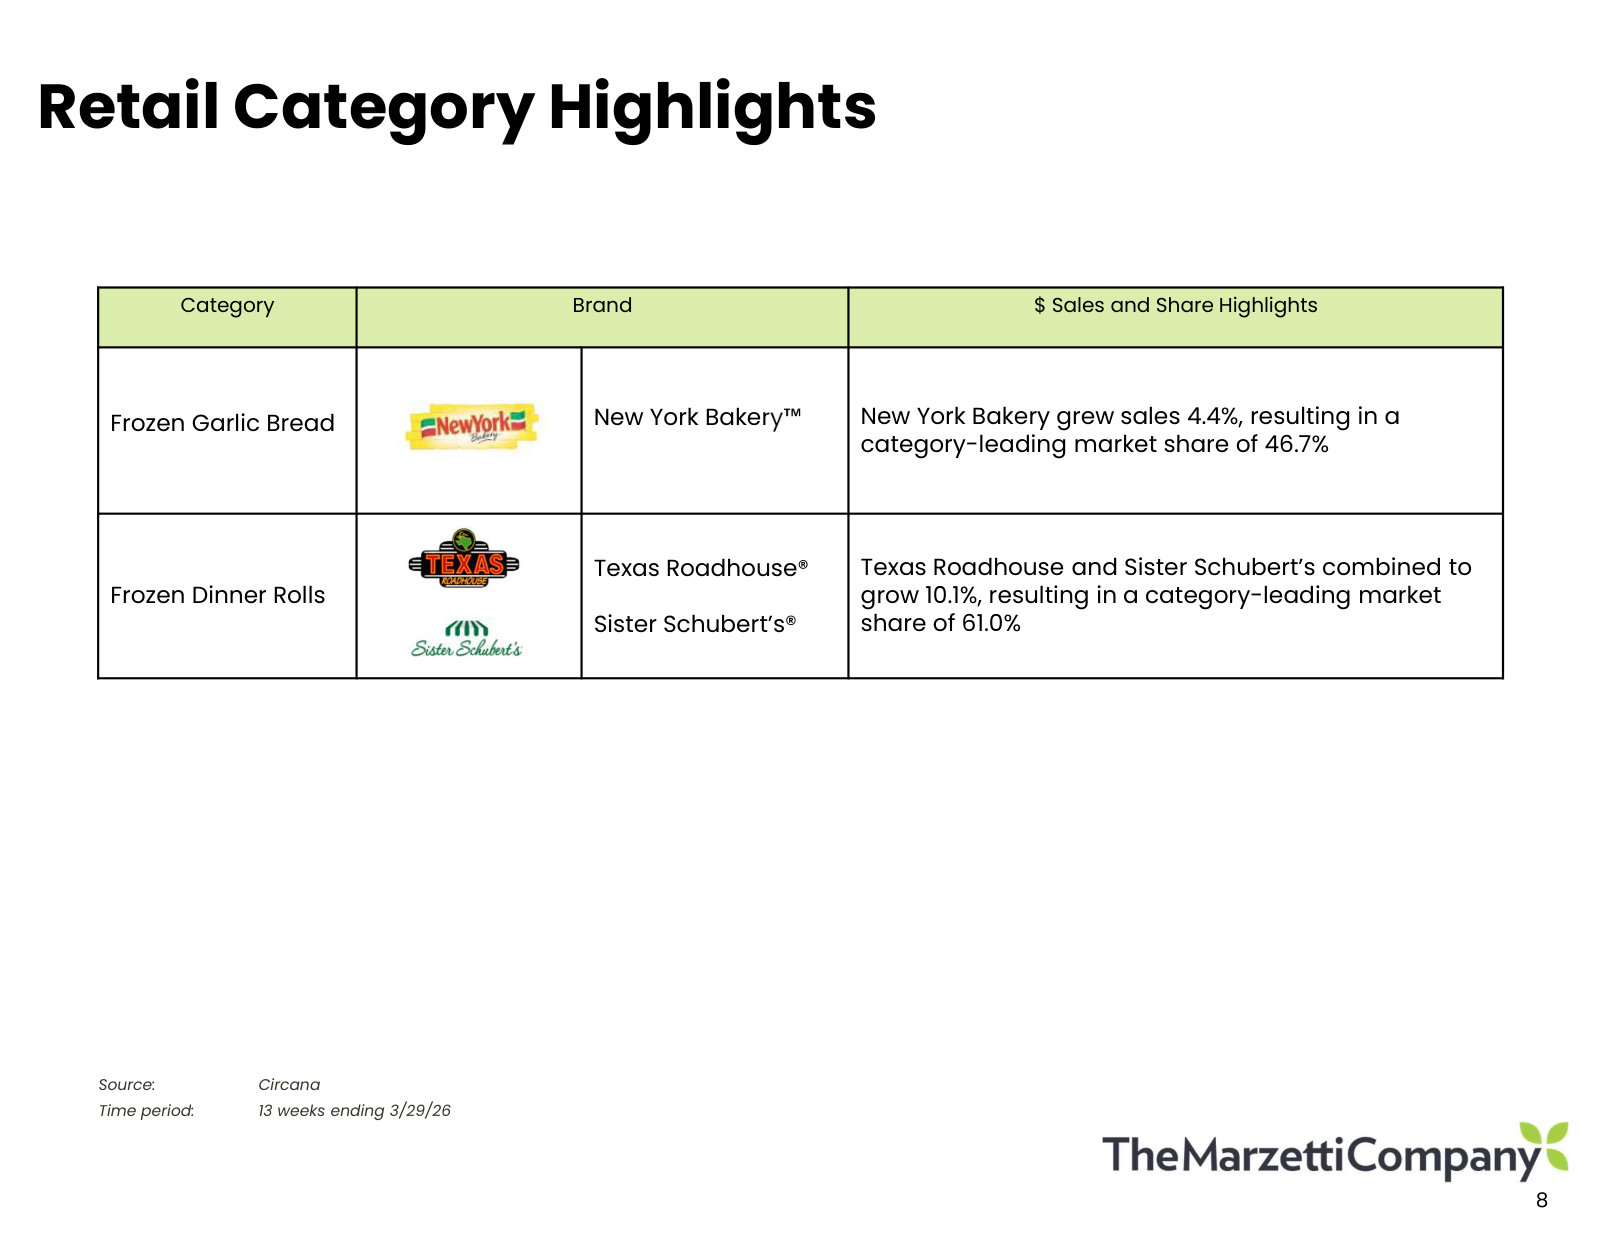
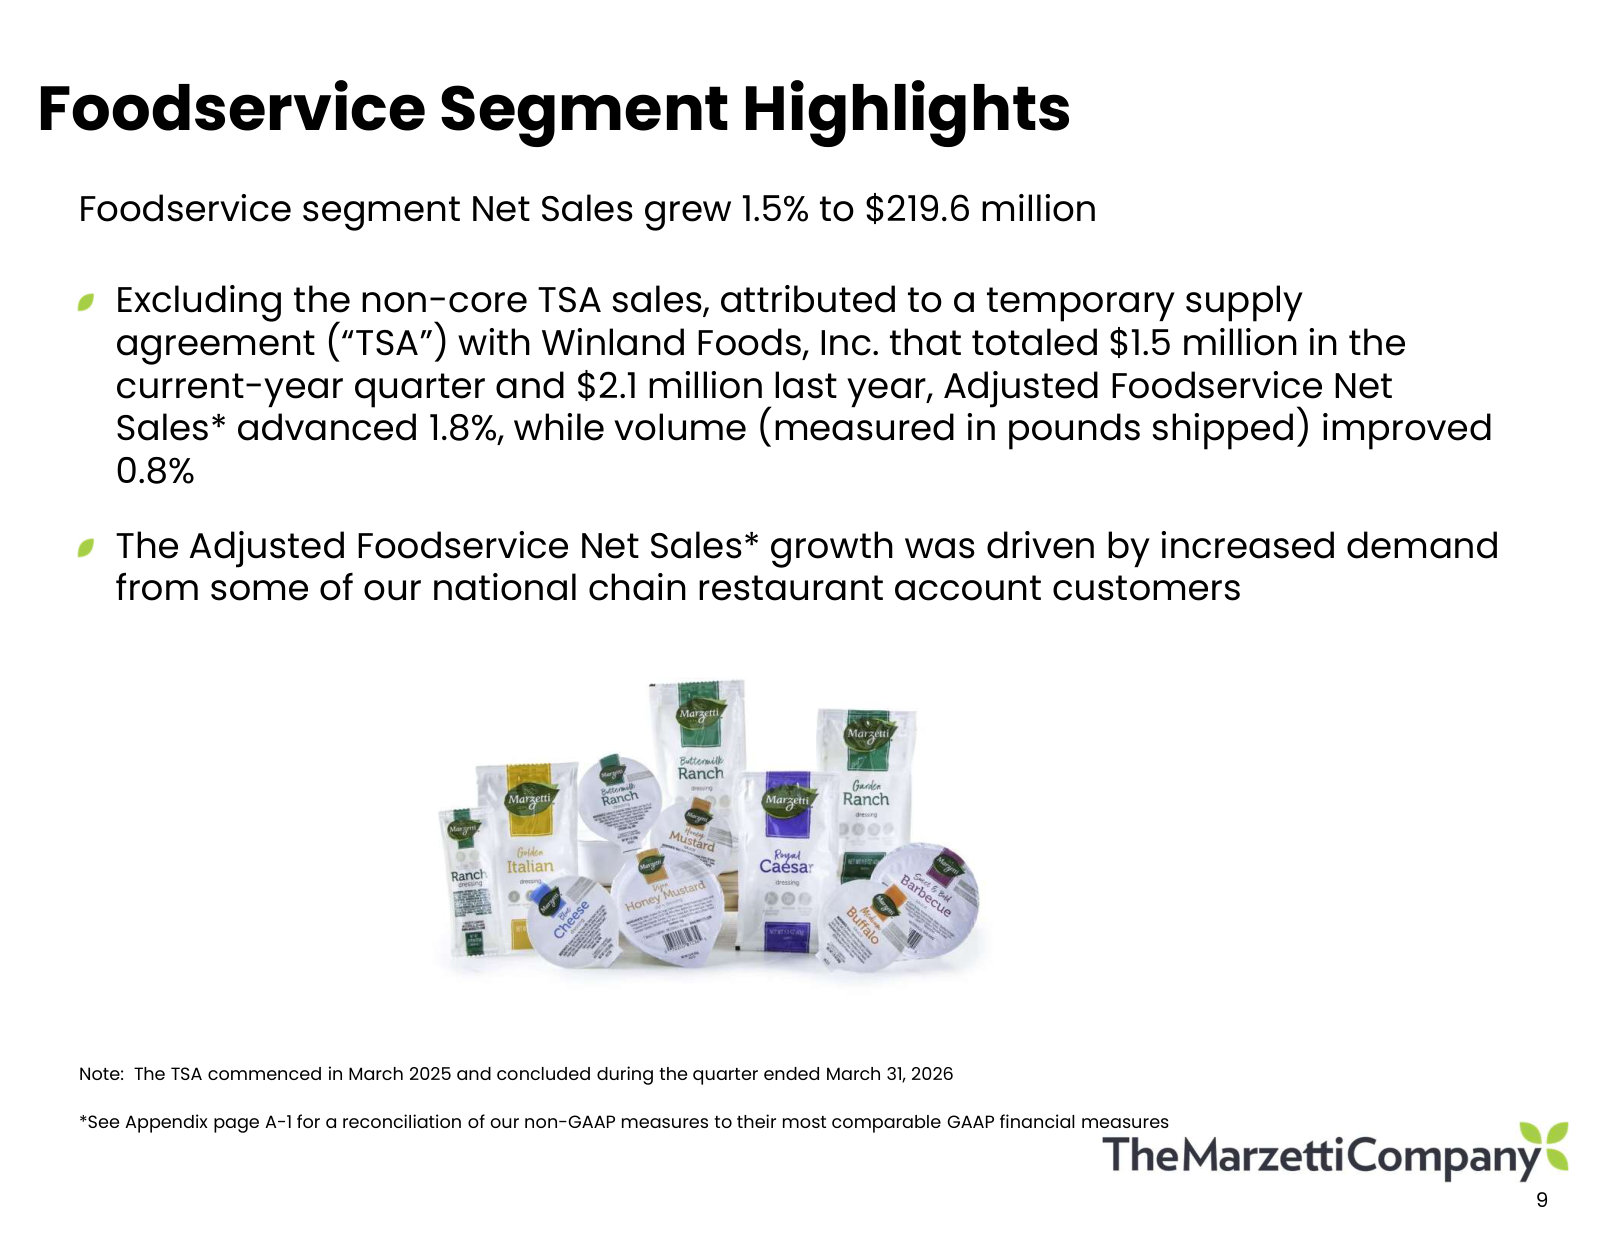
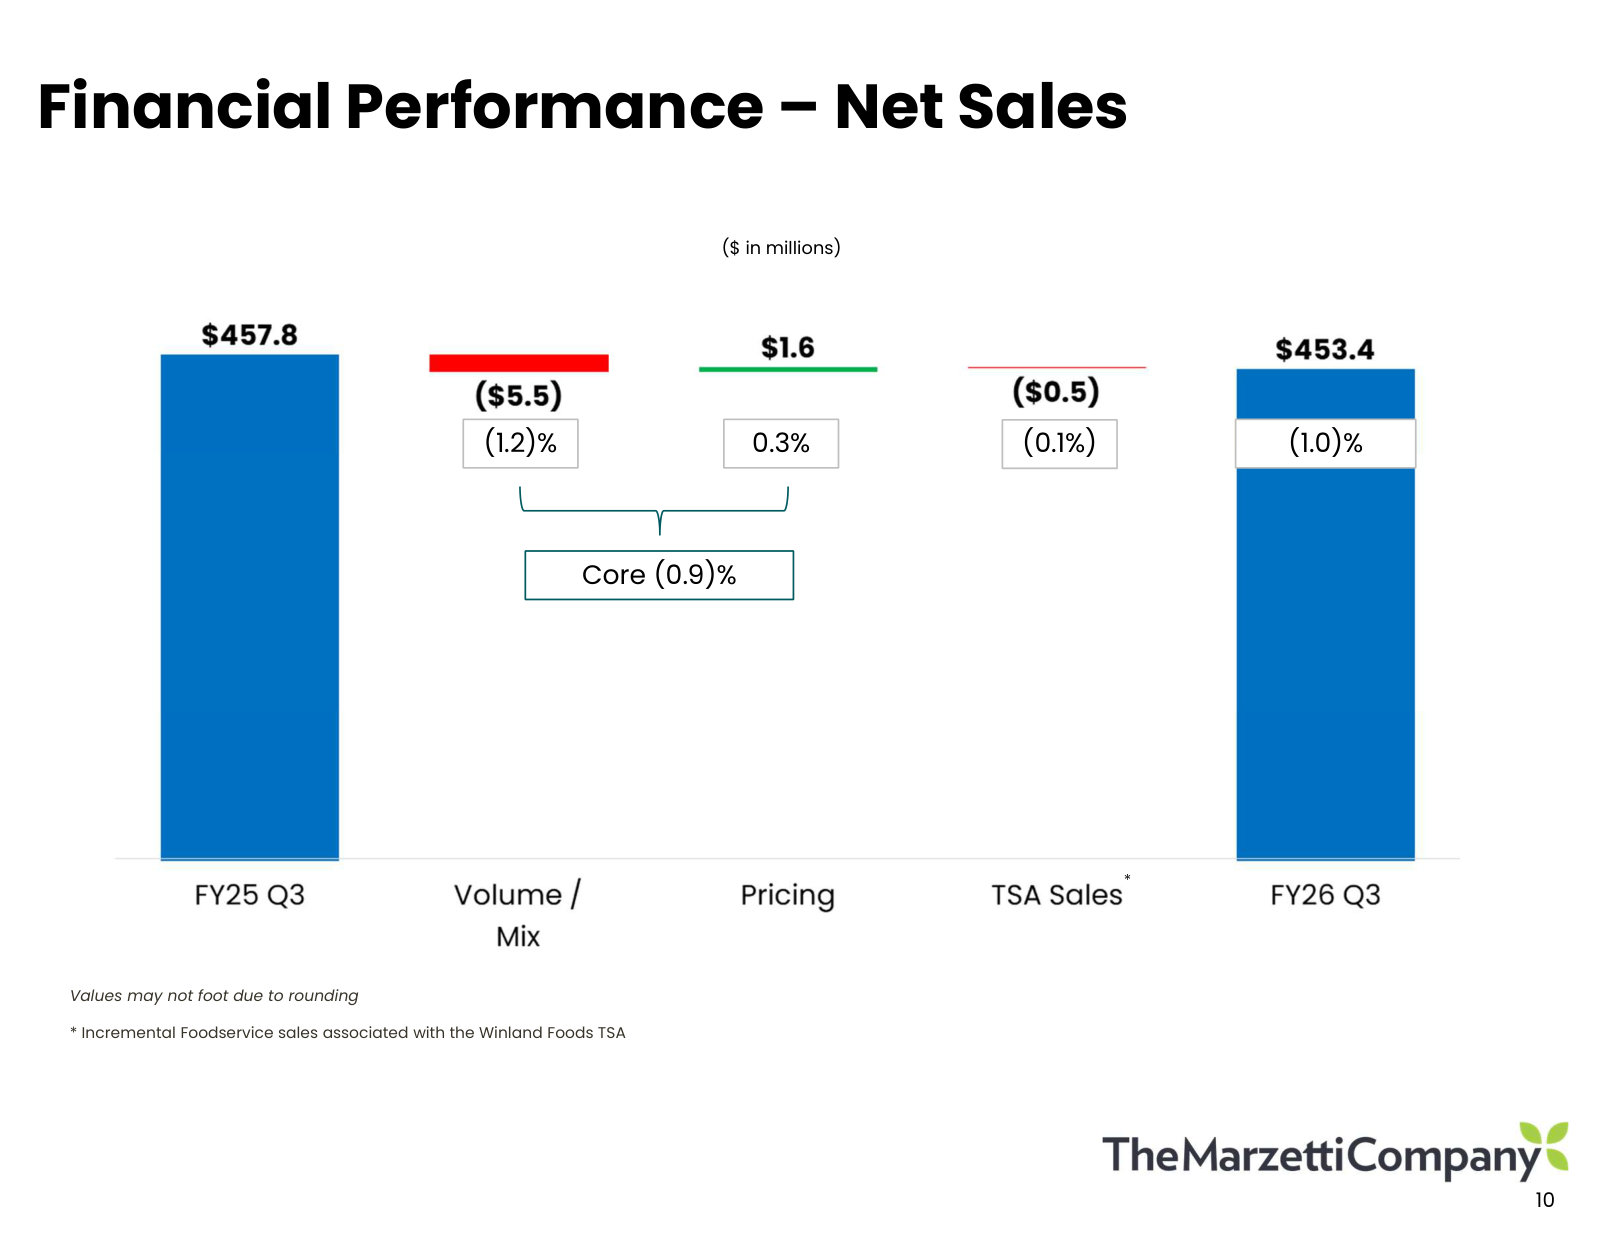
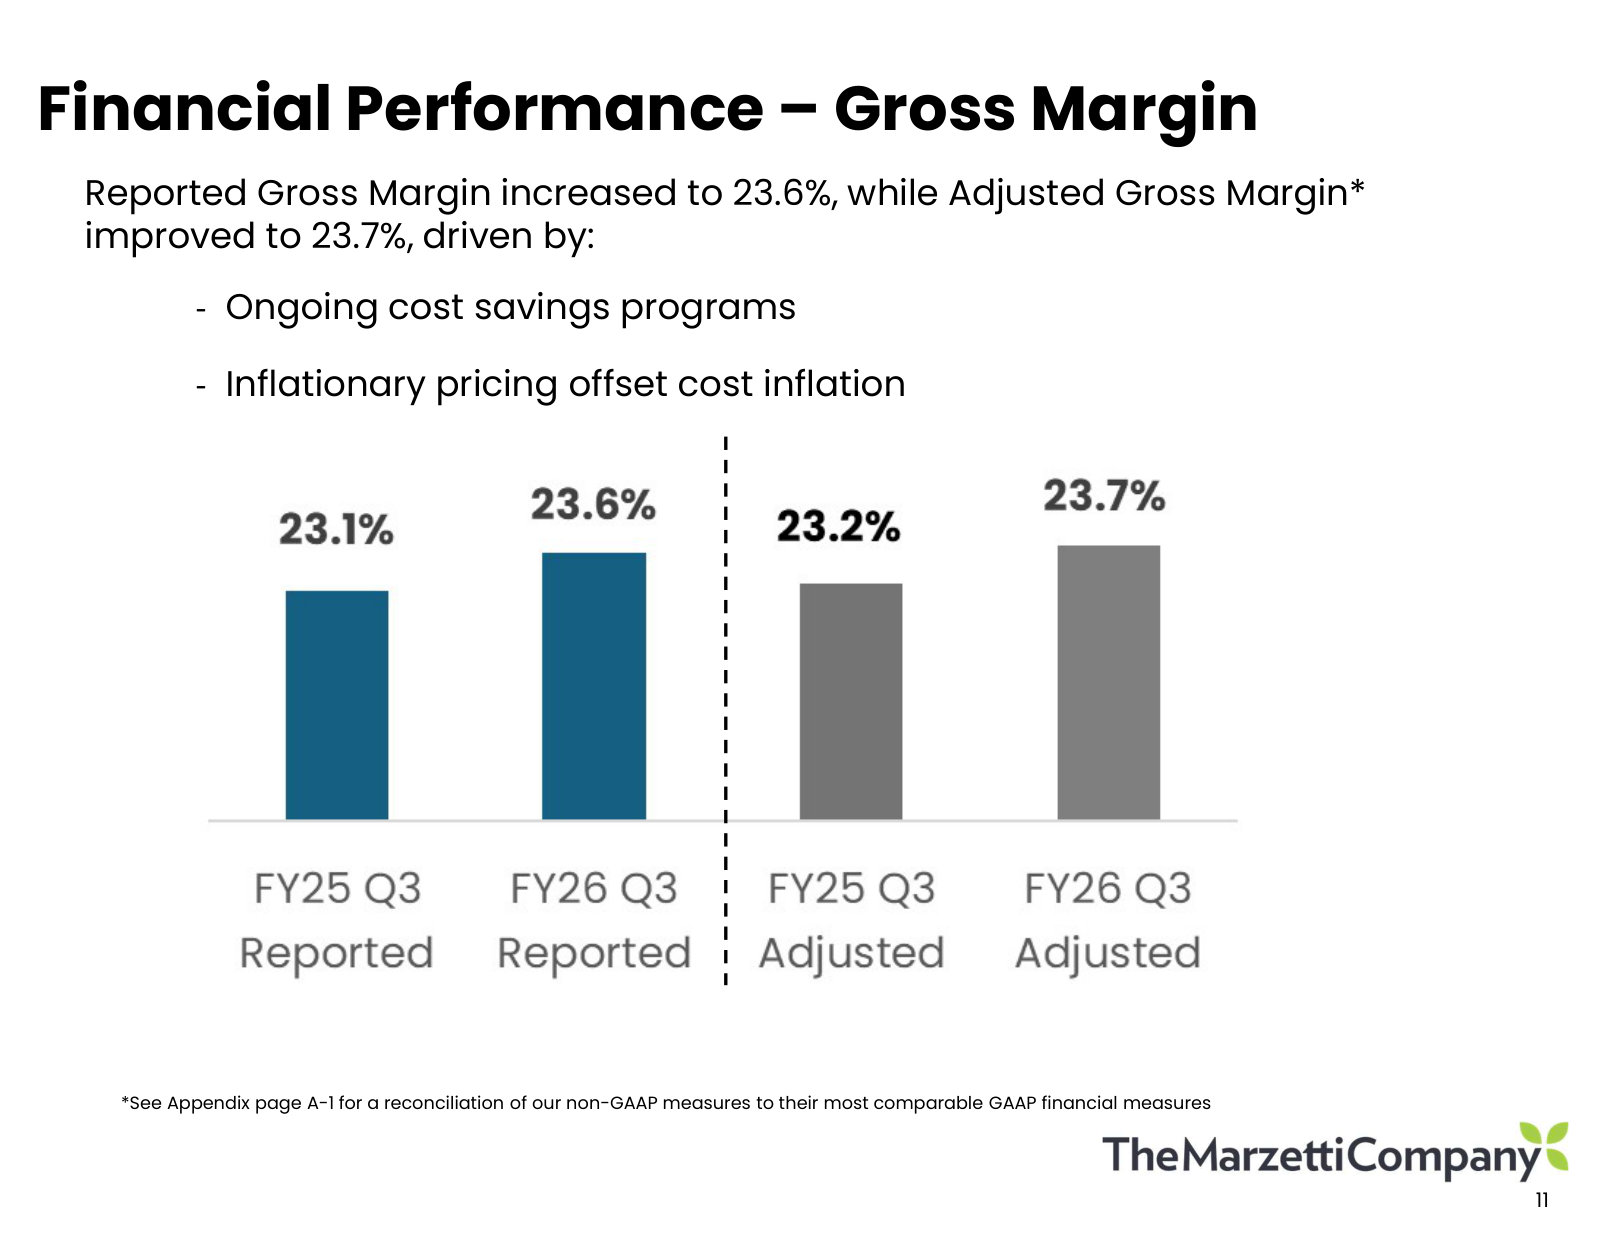
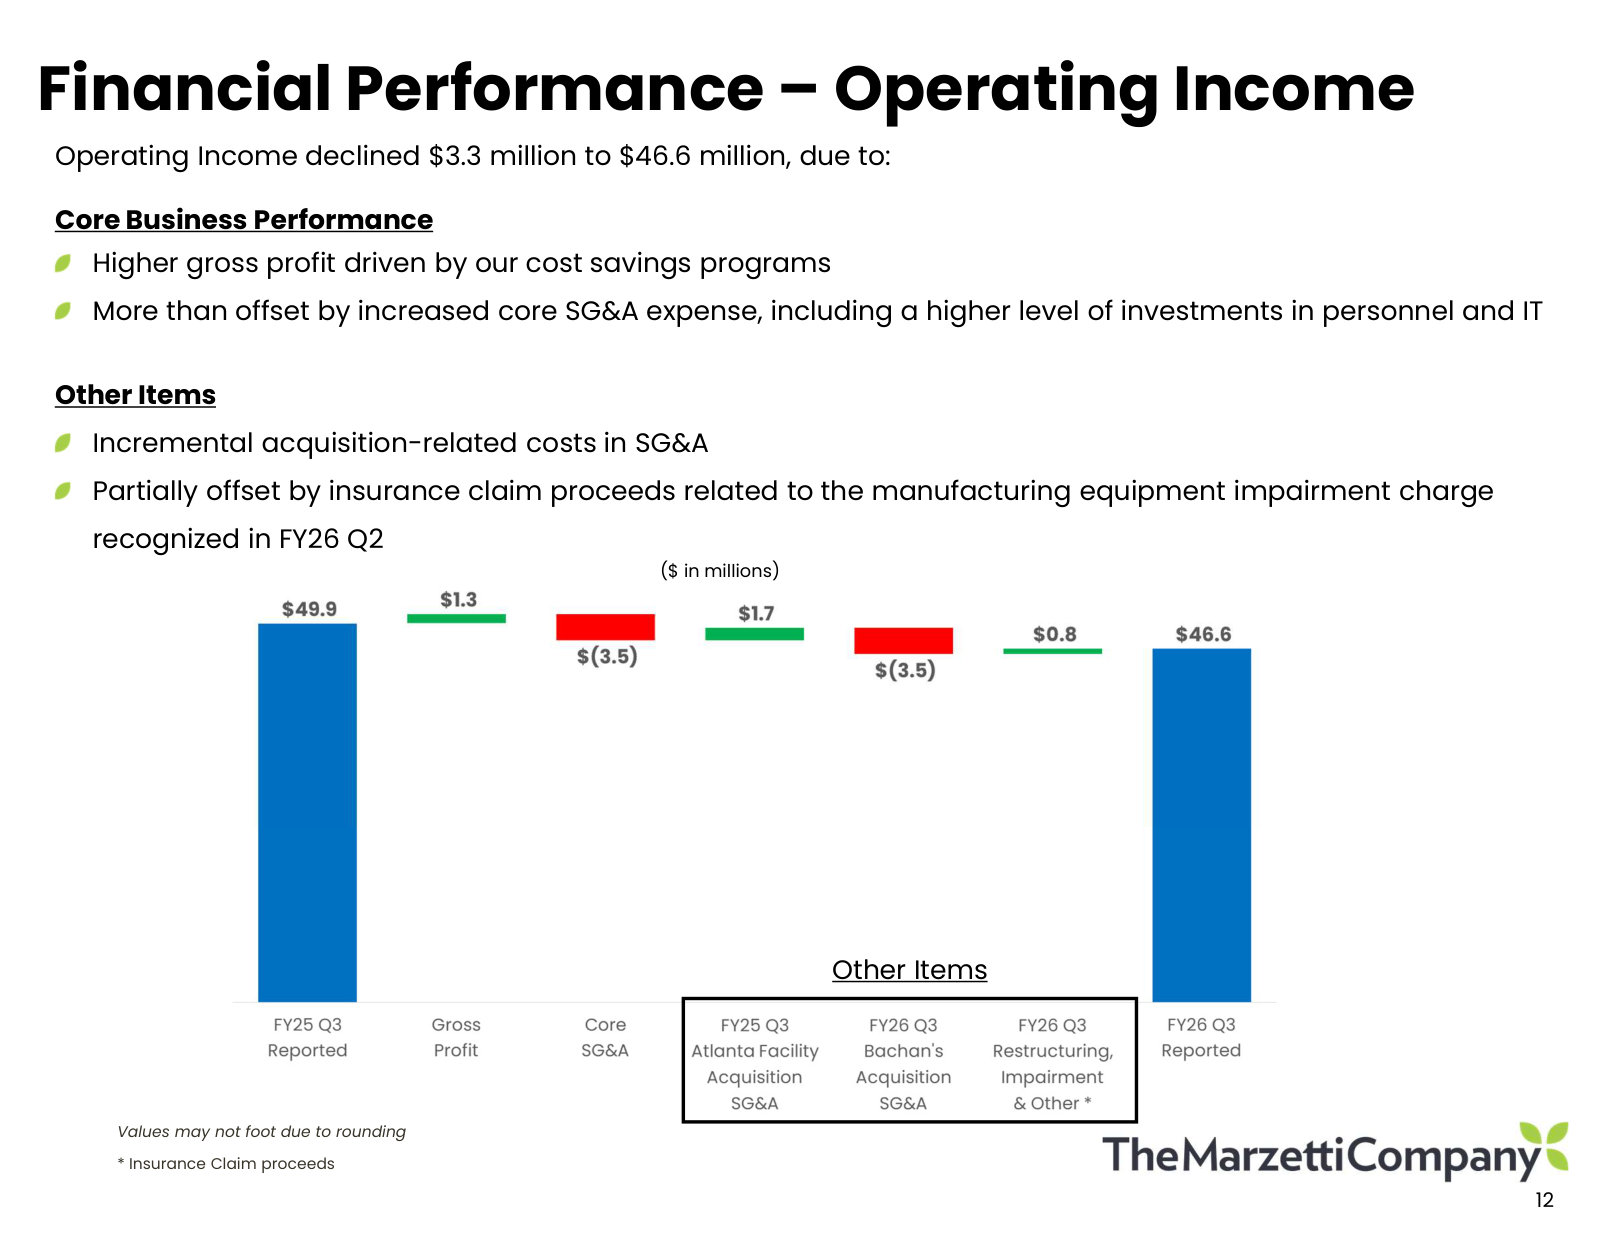
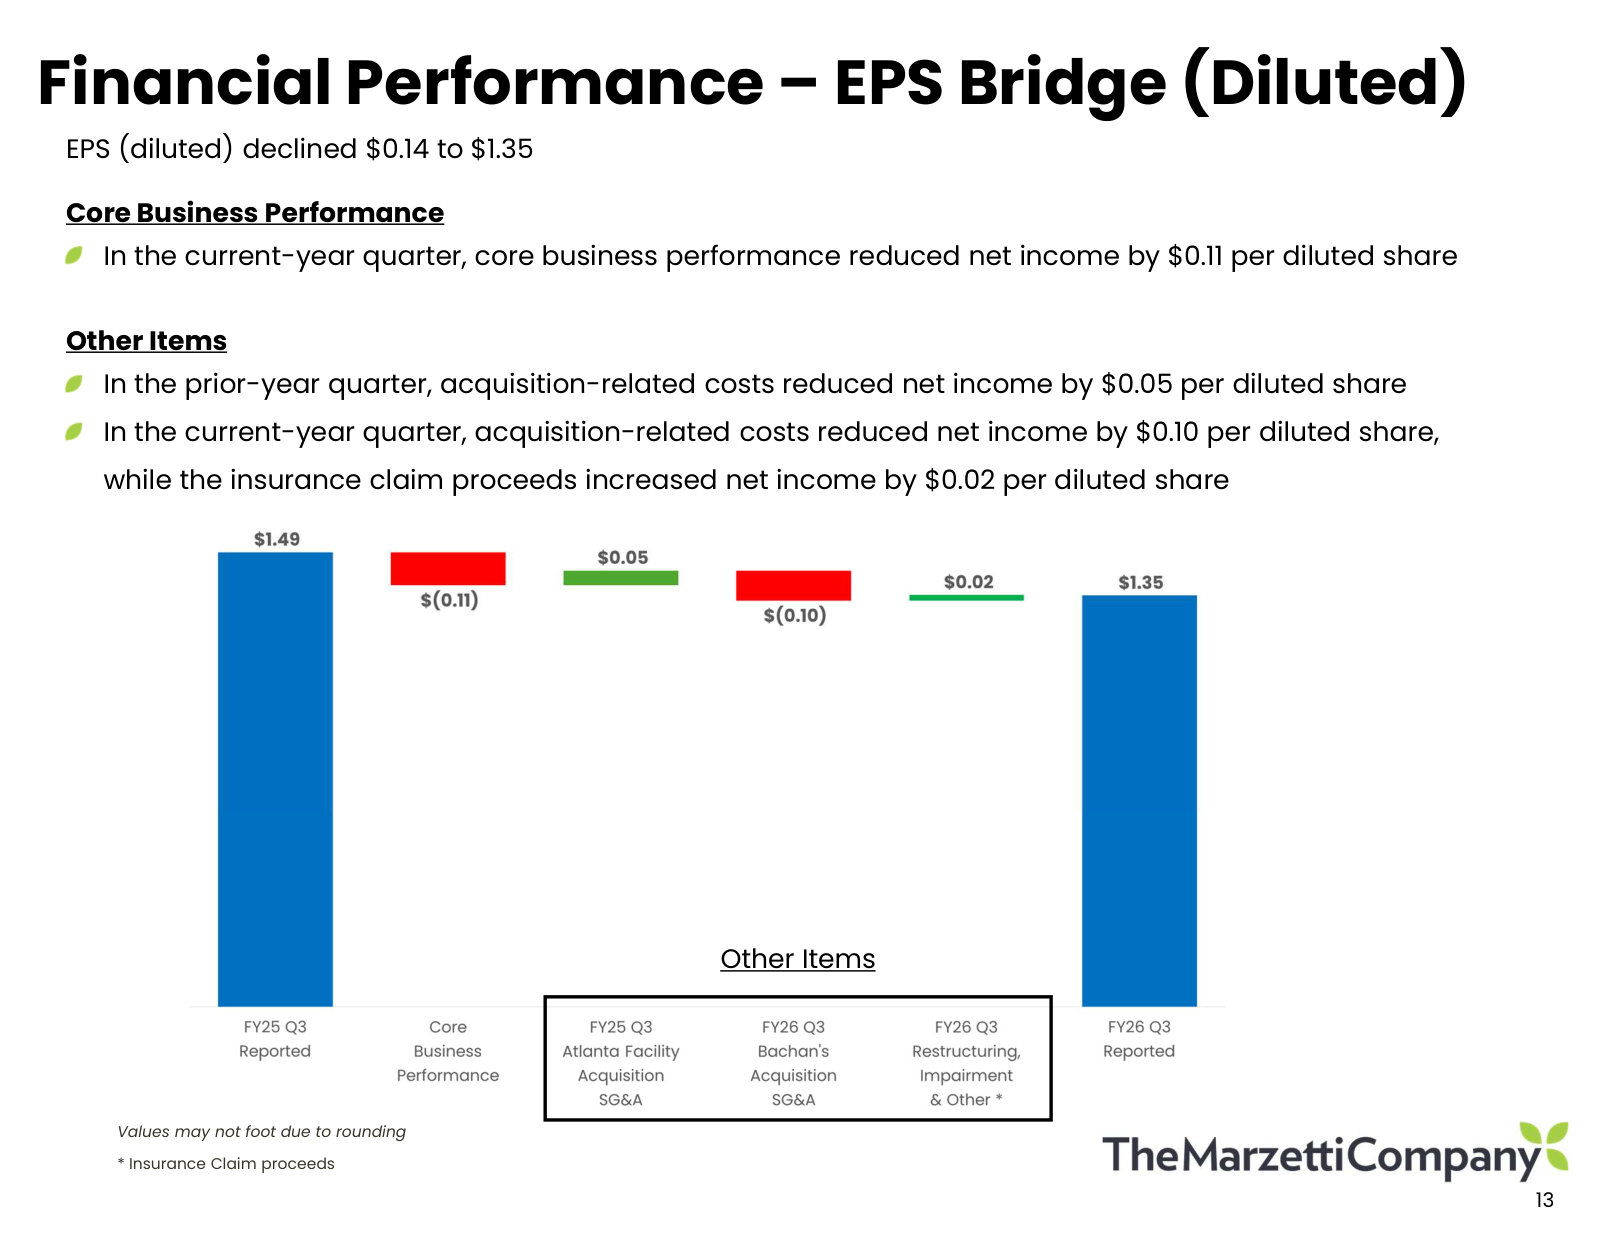
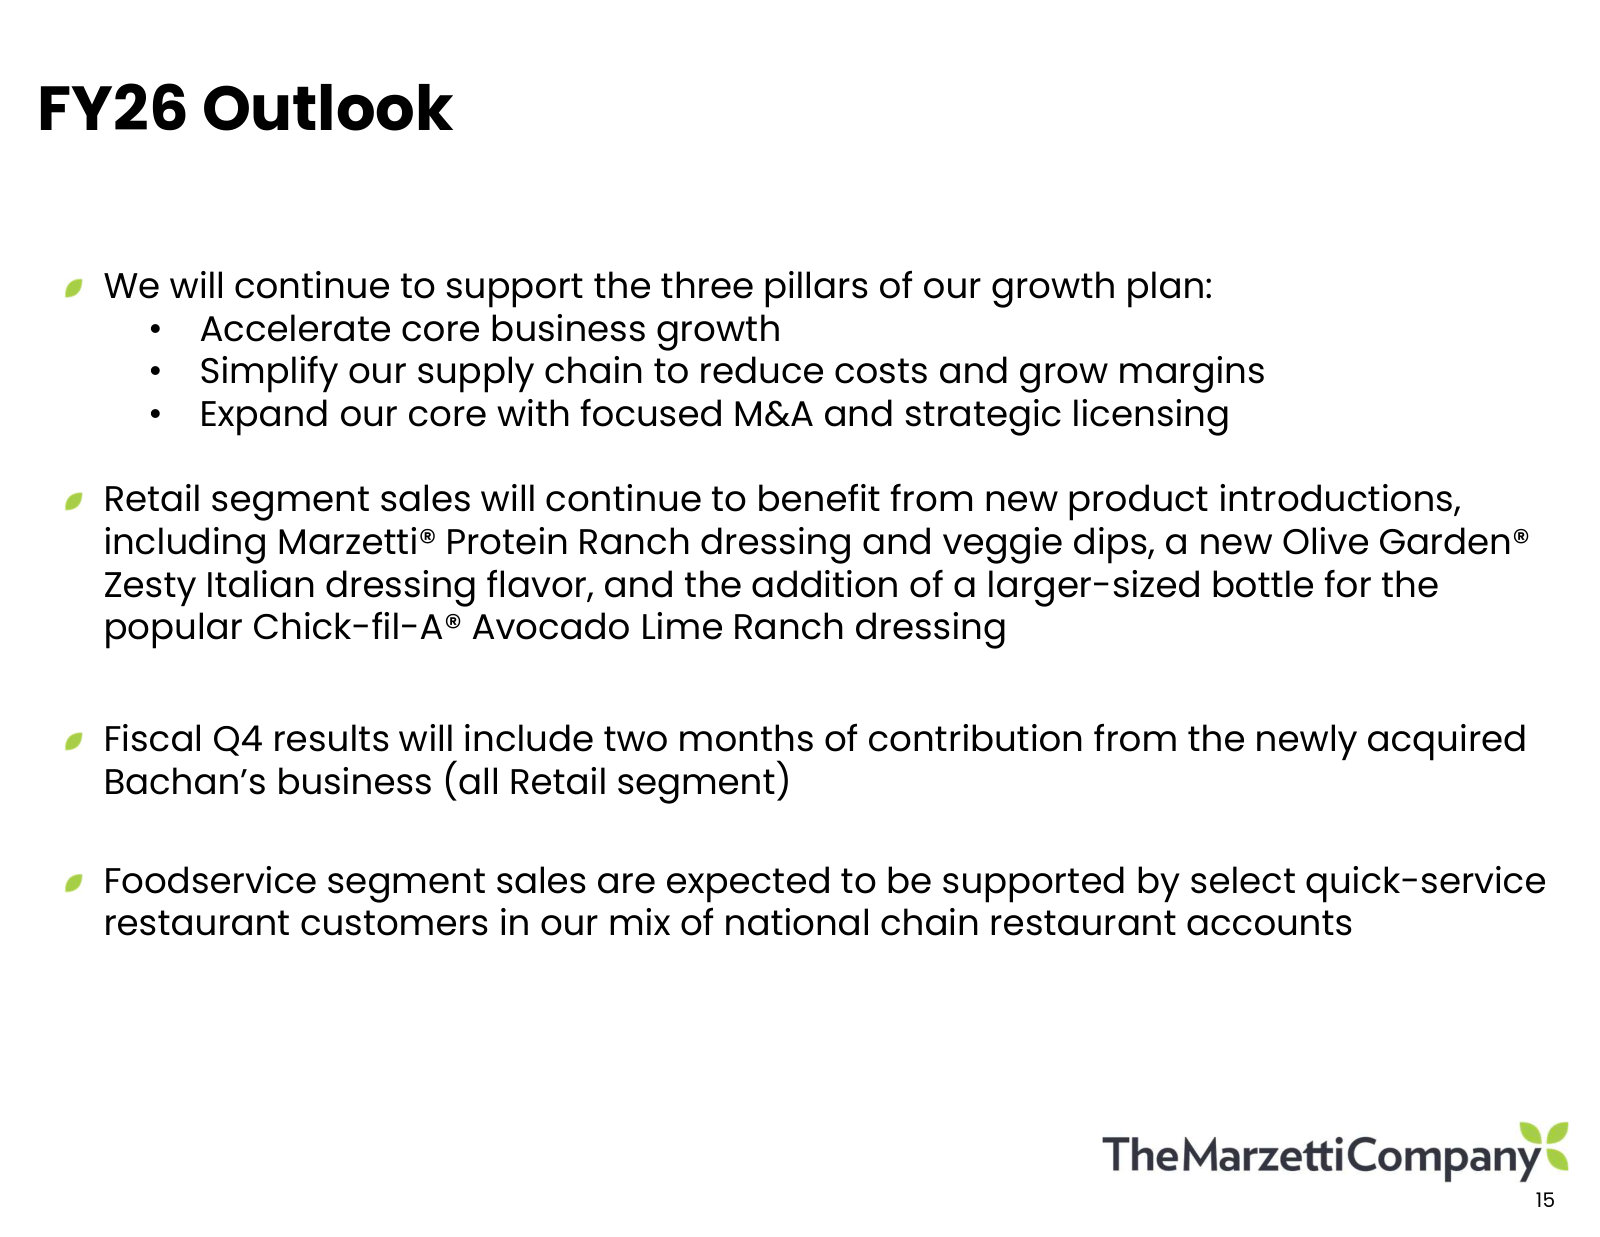
p. 7 — Retail in the March quarter: sales down 3.2% and volume down 5.6%, with frozen breads the part that worked. · Open the full presentation →p. 8 — Circana share for the quarter: New York Bakery at 46.7% of frozen garlic bread, dinner rolls at 61.0%. · Open the full presentation →p. 9 — Foodservice grew 1.5%, and 1.8% excluding the winding-down Winland supply agreement — demand from national chain accounts. · Open the full presentation →p. 10 — The net sales bridge: volume and mix cost 1.2 points, pricing added 0.3, leaving core sales down 0.9%. · Open the full presentation →p. 11 — Gross margin up 50 basis points to 23.6% on cost savings and pricing — the margin story in one comparison. · Open the full presentation →p. 12 — Operating income fell $3.3m: higher gross profit more than offset by SG&A investment and Bachan's deal costs. · Open the full presentation →p. 13 — The same walk at the per-share level, separating core performance from acquisition costs and insurance proceeds. · Open the full presentation →p. 15 — The FY26 outlook and the three pillars of the growth plan, including two months of Bachan's in the fourth quarter. · Open the full presentation →
The standalone deal deck for the $400m Bachan's acquisition - the only document that states the price and the original rationale. · Open the full document →
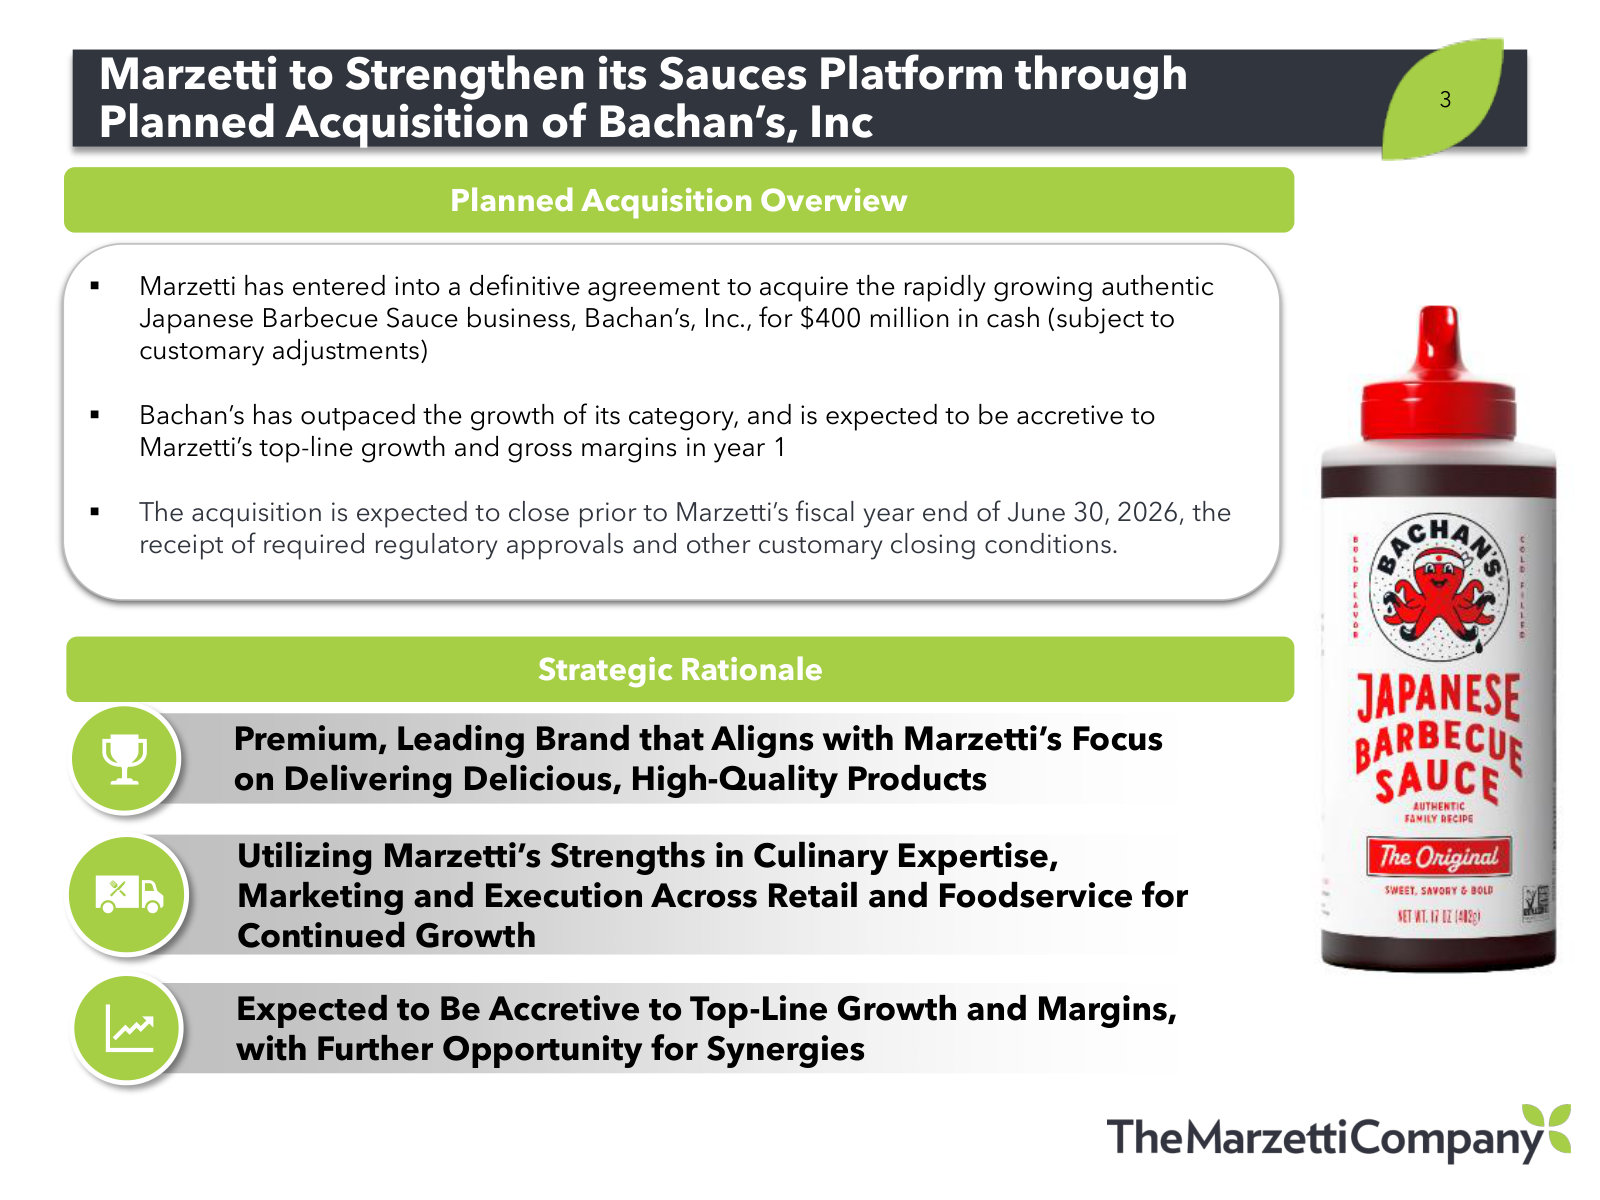
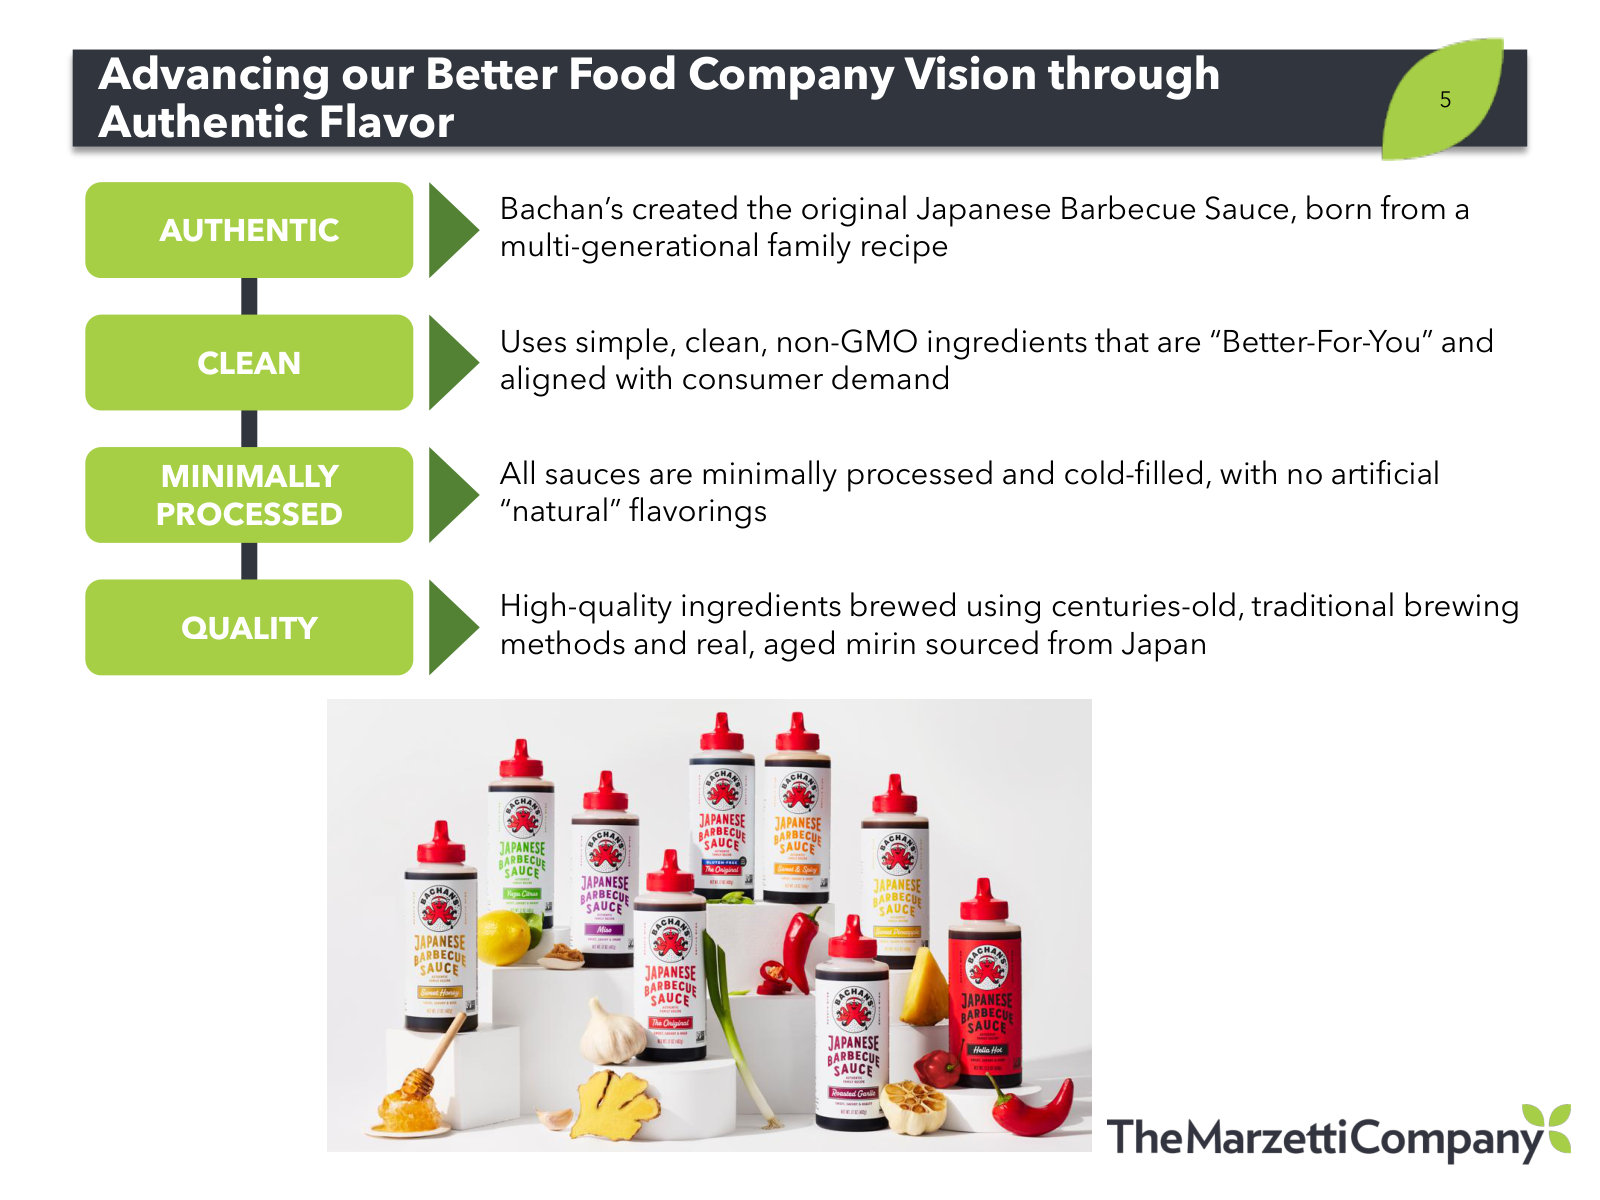
p. 3 — The deal terms: $400m in cash for Bachan's, expected to be accretive to growth and gross margin in year one. · Open the full presentation →p. 5 — Why management says the brand fits the 'better food company' vision — authentic, clean-label, minimally processed, premium. · Open the full presentation →
Investor Presentation - March 2026 — March 2026 · 50 pages · The same overview deck while Bachan's was still pending, with first-half FY26 financials. · Open →
FY26 Q2 Earnings Presentation — FY26 Q2 · 16 pages · The December-quarter results, reported the same day the Bachan's acquisition was announced. · Open →
Stephens Investment Conference - November 2025 — November 2025 · 48 pages · The conference version of the story just after the rename, before Bachan's entered the plan. · Open →
Investor Presentation - September 2025 — September 2025 · 45 pages · The first overview deck under the Marzetti name, with full FY25 numbers as originally presented. · Open →
FY25 Q4 Earnings Presentation — FY25 Q4 · 16 pages · Fiscal 2025 full-year results and management's explanation of the Lancaster Colony to Marzetti rebranding. · Open →
Investor Presentation - June 2025 — June 2025 · 45 pages · The last overview deck presented as Lancaster Colony, for comparing the strategy language before the rename. · Open →
Stephens Investment Conference - November 2024 — November 2024 · 44 pages · A two-year-old baseline: the growth and supply chain plans set out before the Atlanta plant and Bachan's. · Open →